Monitoring Harbor with Azure Monitor and Azure Managed Grafana
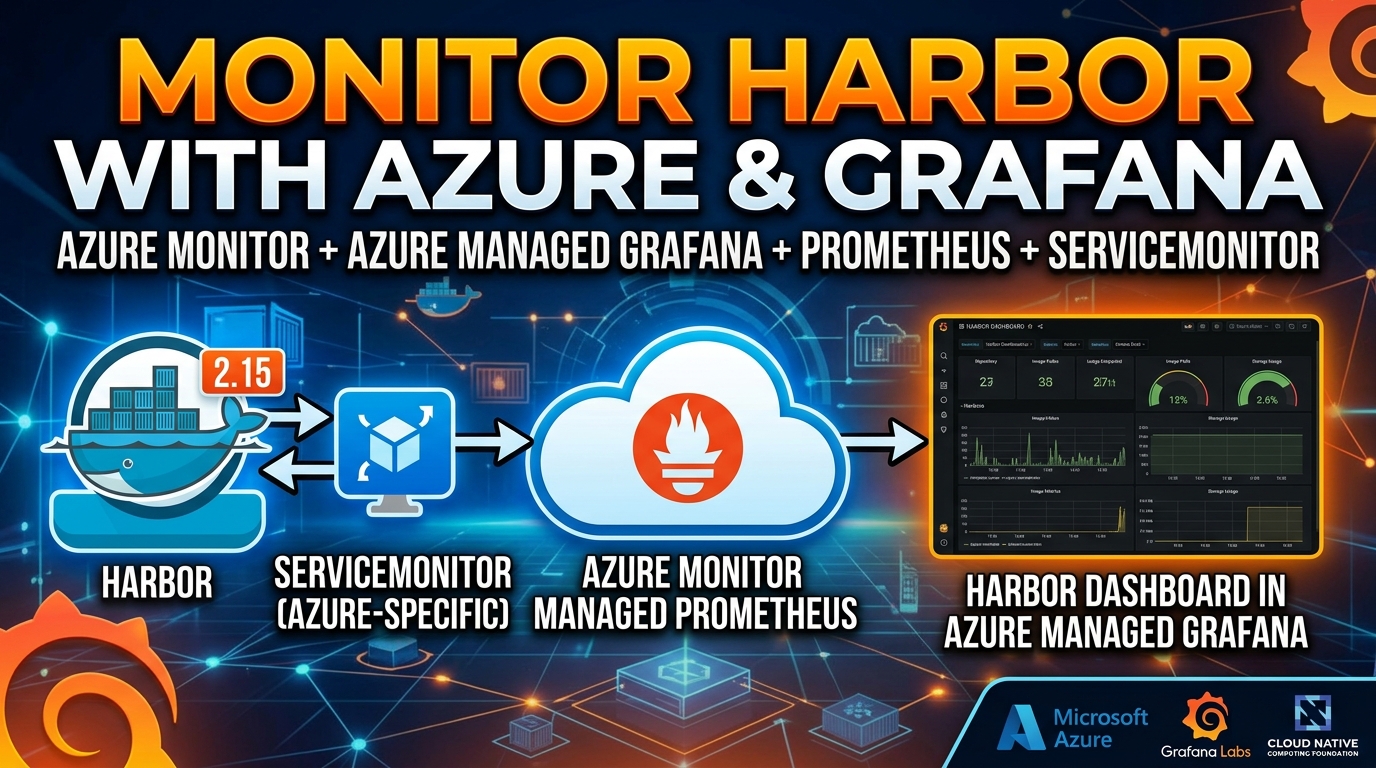
Collect Harbor 2.15 metrics with an Azure-specific ServiceMonitor, verify ingestion in Azure Monitor managed Prometheus, and build a Harbor dashboard in Azure Managed Grafana.
Practical guides and insights on cloud infrastructure, DevOps, and modern engineering practices.
Collect Harbor 2.15 metrics with an Azure-specific ServiceMonitor, verify ingestion in Azure Monitor managed Prometheus, and build a Harbor dashboard in Azure Managed Grafana.
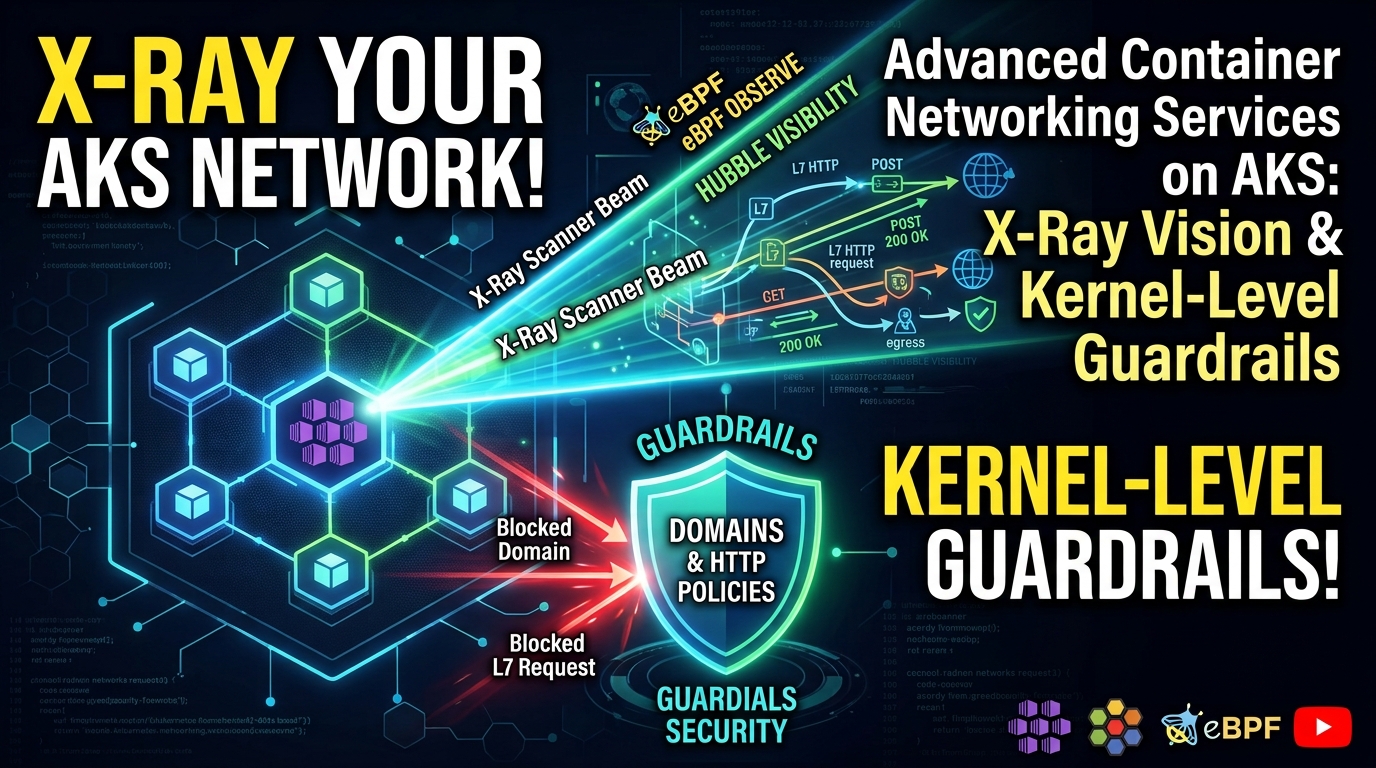
What Advanced Container Networking Services (ACNS) actually gives you on AKS — eBPF-powered network observability with Hubble, domain-based egress filtering, and HTTP-aware Layer 7 policies — explained through a hands-on demo you can run yourself.
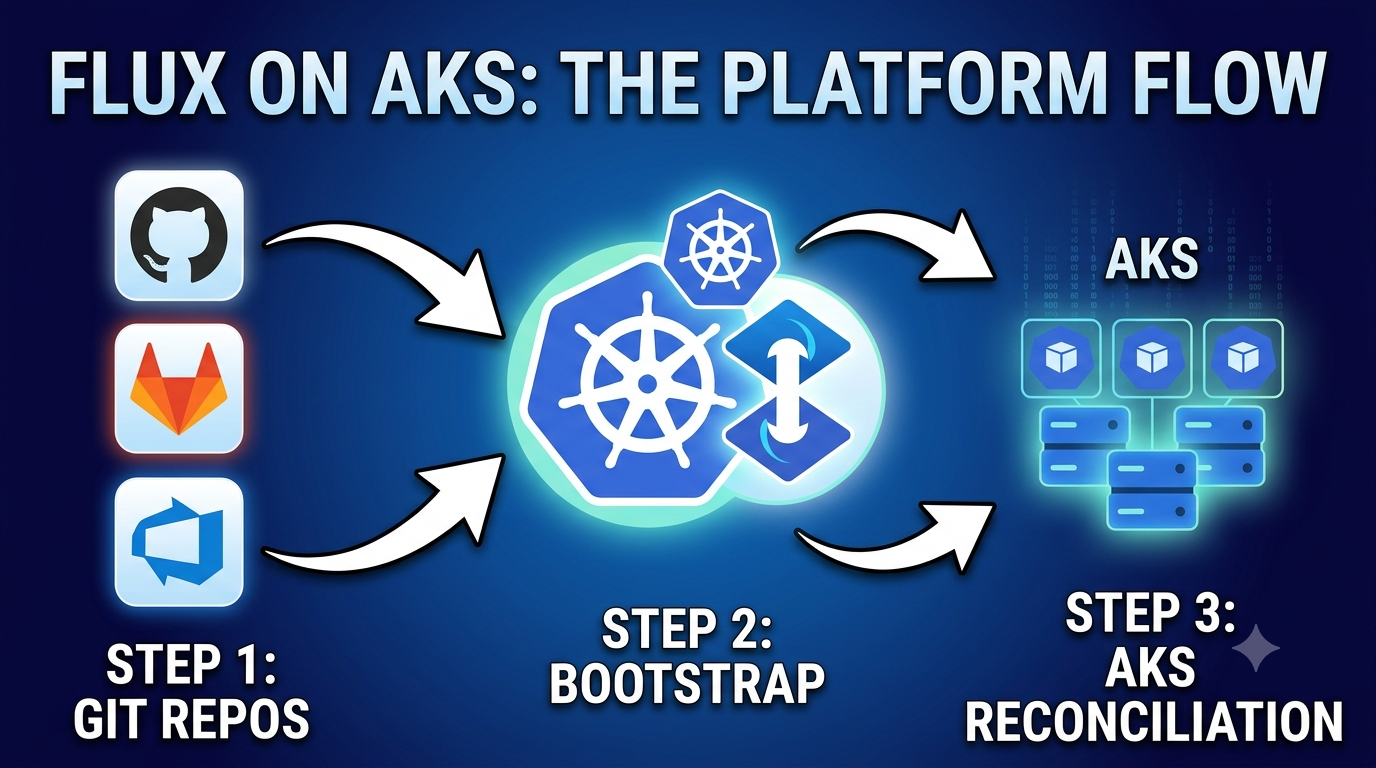
A practical walkthrough to bootstrap Flux on an AKS cluster, connect it to an external Git repository (GitHub, Azure DevOps, GitLab, and more), and declare reconciliation with GitRepository and Kustomization CRDs.
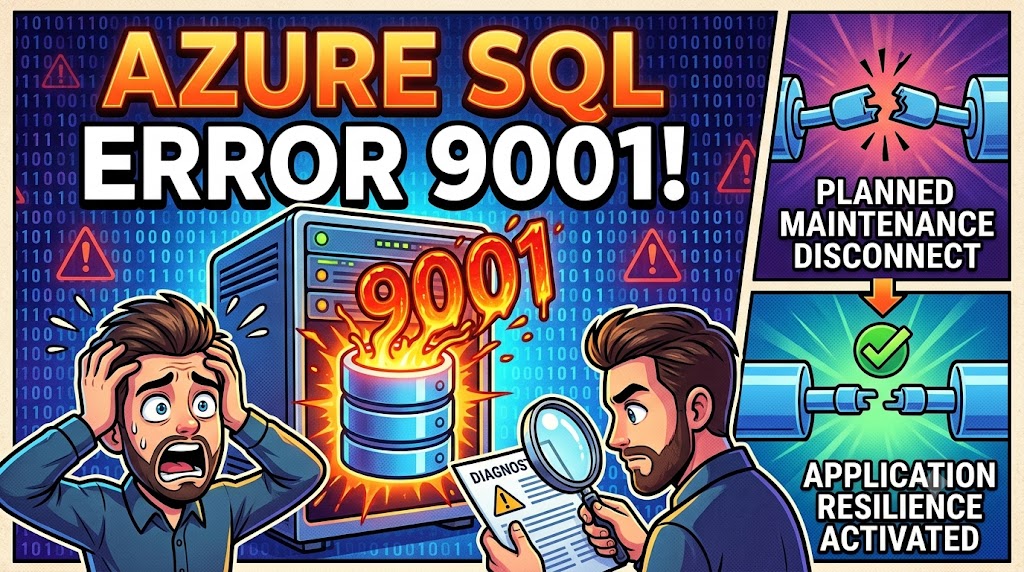
A real-world look at SQL error 9001 in Azure SQL diagnostic logs — what it means, why it happens during planned maintenance reconfigurations, and how to make your application resilient against it.
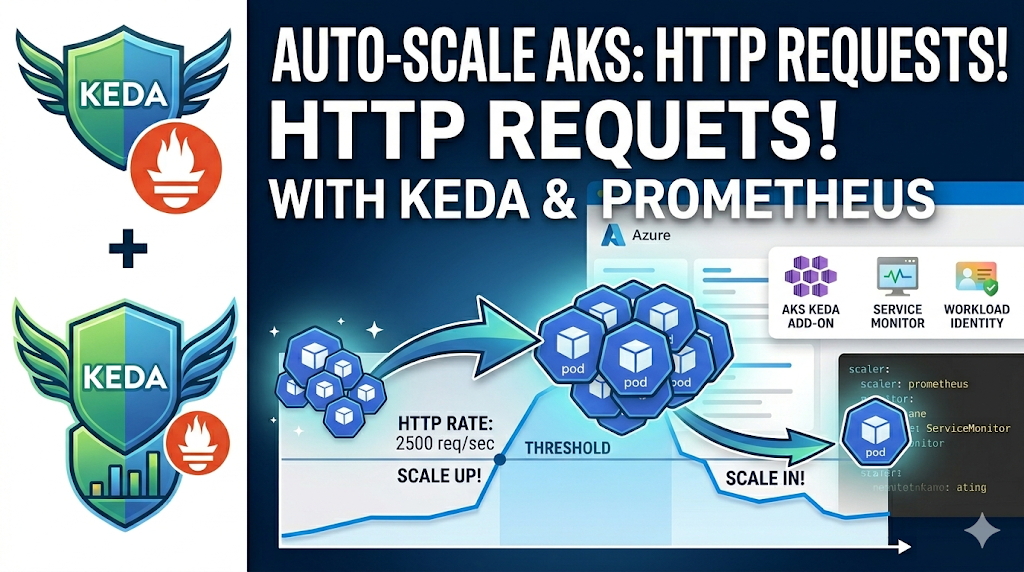
A hands-on demo using the AKS KEDA add-on and Azure Managed Prometheus to autoscale a Deployment on HTTP request rate. Covers the Prometheus scaler, ServiceMonitor scraping, Workload Identity authentication, and watching pods scale out and back in.
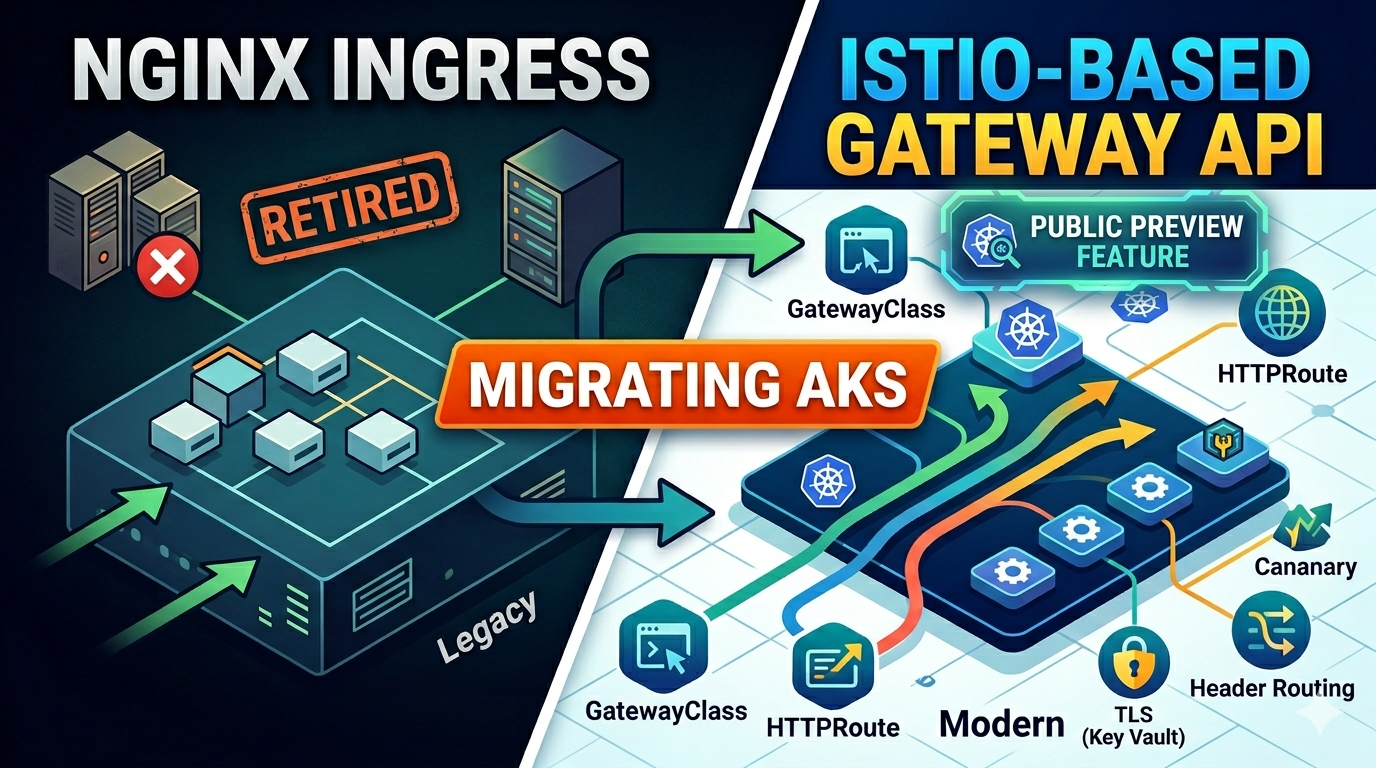
NGINX Ingress is retired. This guide walks through migrating AKS workloads to the App Routing add-on with Istio-based Gateway API, including GatewayClass, HTTPRoute, TLS from Key Vault, canary traffic splits, and header-based routing.