
Making the AKS Control Plane Less of a Black Box with Managed Prometheus
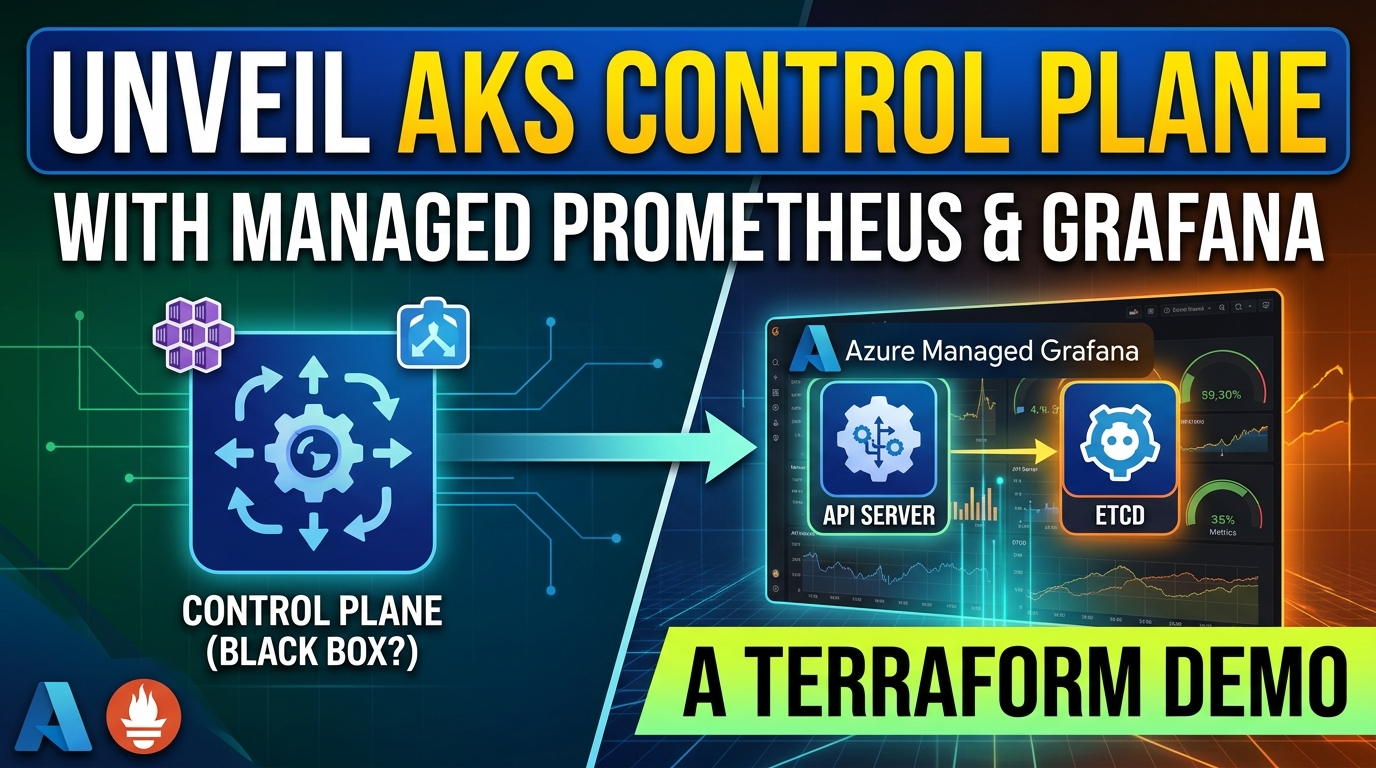
A Terraform demo for enabling AKS control plane metrics, tuning Prometheus collection, and exploring API server and etcd dashboards in Azure Managed Grafana.
A Terraform demo for enabling AKS control plane metrics, tuning Prometheus collection, and exploring API server and etcd dashboards in Azure Managed Grafana.
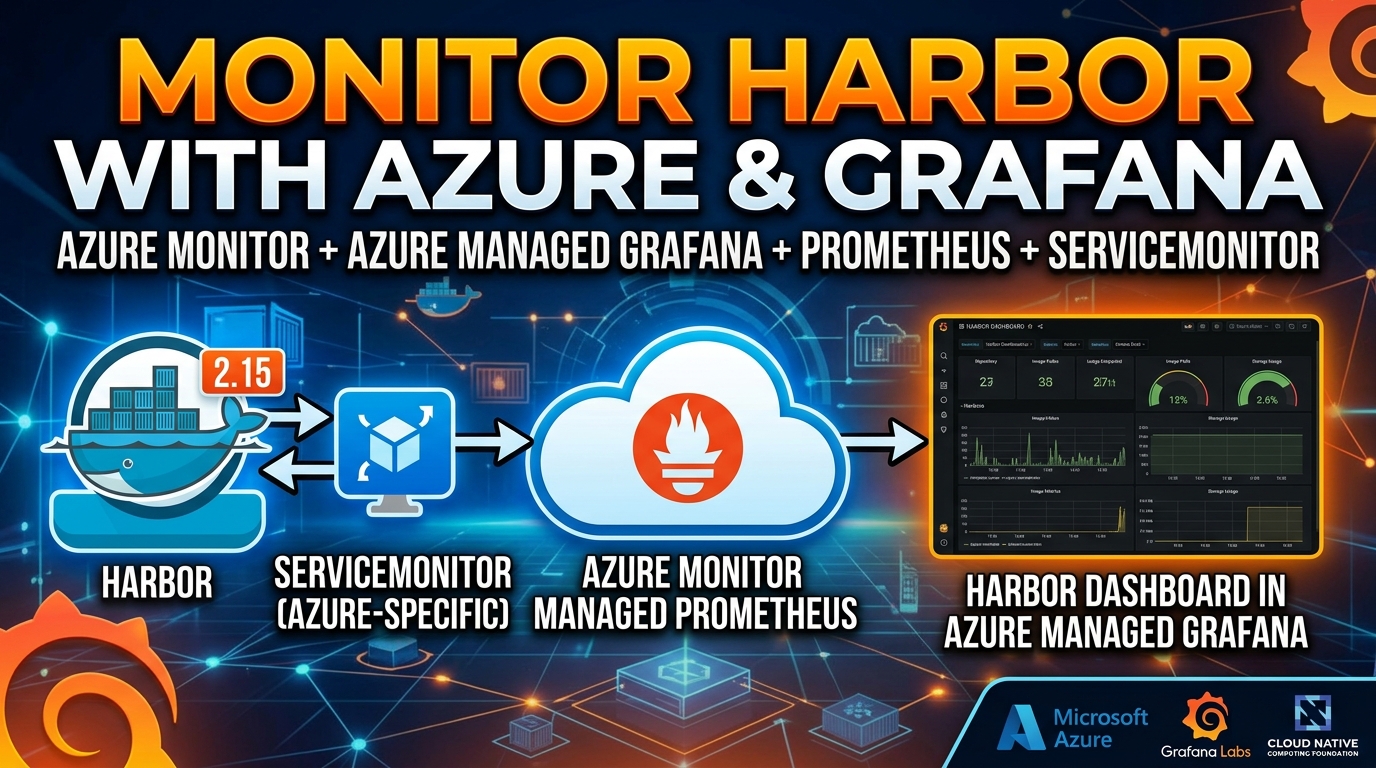
Collect Harbor 2.15 metrics with an Azure-specific ServiceMonitor, verify ingestion in Azure Monitor managed Prometheus, and build a Harbor dashboard in Azure Managed Grafana.
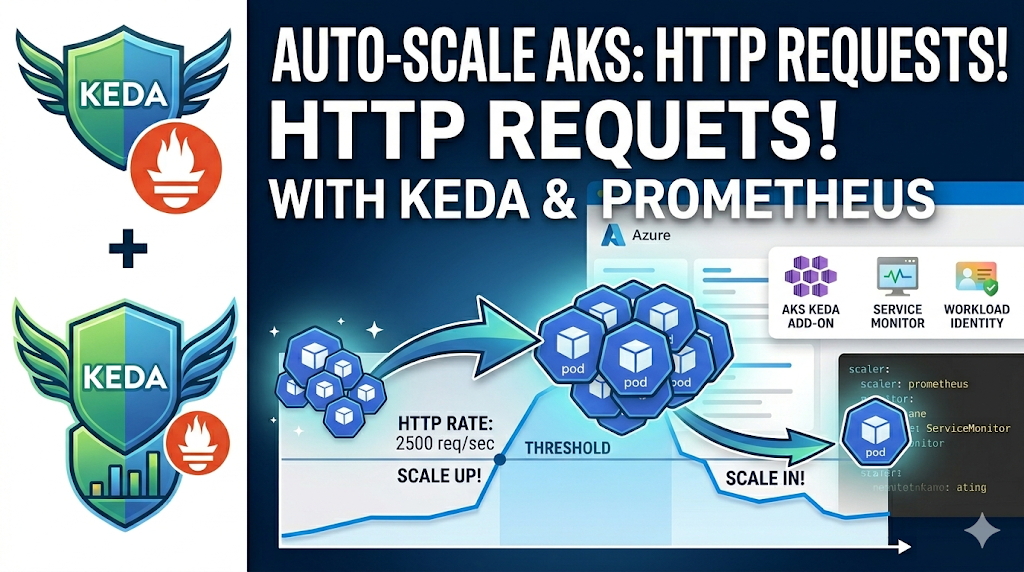
A hands-on demo using the AKS KEDA add-on and Azure Managed Prometheus to autoscale a Deployment on HTTP request rate. Covers the Prometheus scaler, ServiceMonitor scraping, Workload Identity authentication, and watching pods scale out and back in.