
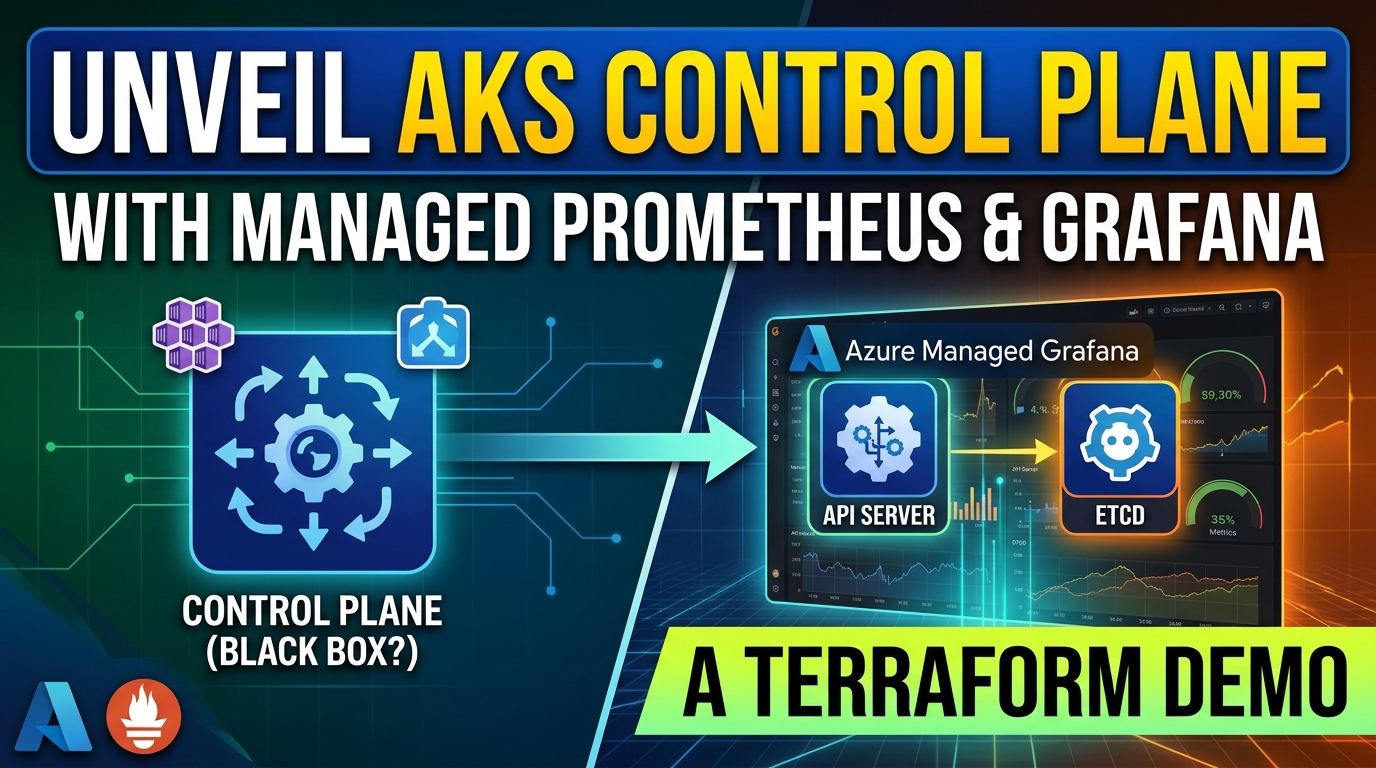
Making the AKS Control Plane Less of a Black Box with Managed Prometheus
A Terraform demo for enabling AKS control plane metrics, tuning Prometheus collection, and exploring API server and etcd dashboards in Azure Managed Grafana.
A Terraform demo for enabling AKS control plane metrics, tuning Prometheus collection, and exploring API server and etcd dashboards in Azure Managed Grafana.
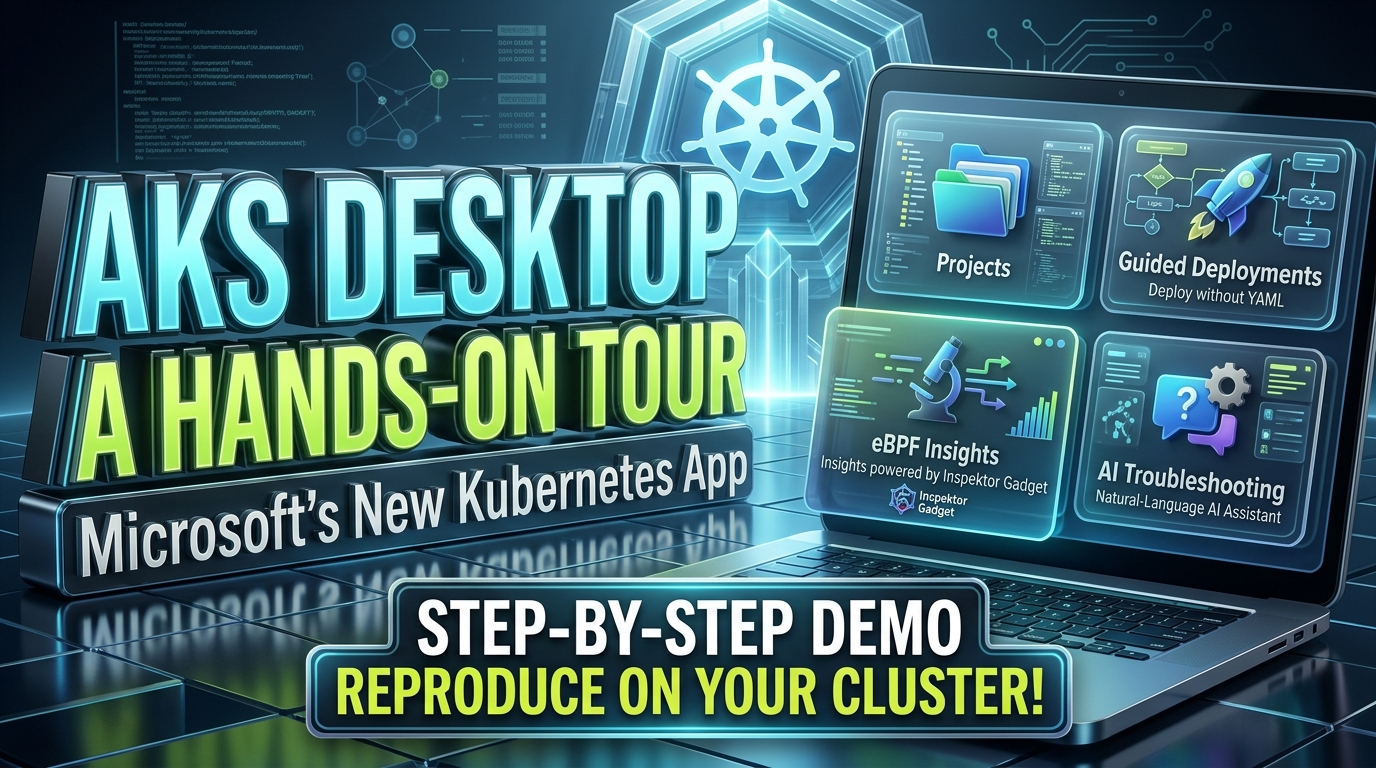
What AKS desktop actually does — Projects, guided deployments without YAML, a natural-language AI troubleshooting assistant, and a built-in plugin catalog — walked through as a demo you can reproduce on your own cluster.
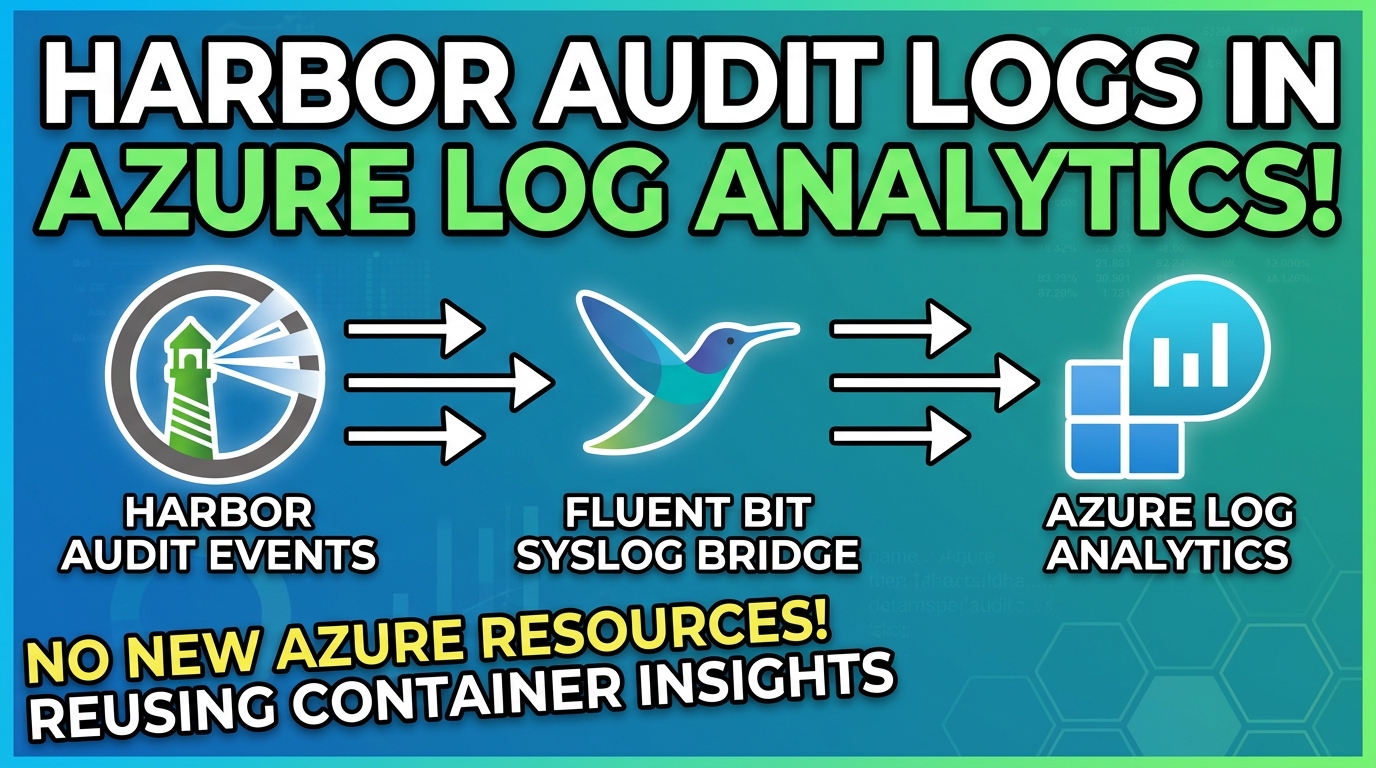
Forward Harbor audit events into Azure Log Analytics with a small Fluent Bit syslog bridge, reusing Container Insights so no new Azure resources are required.
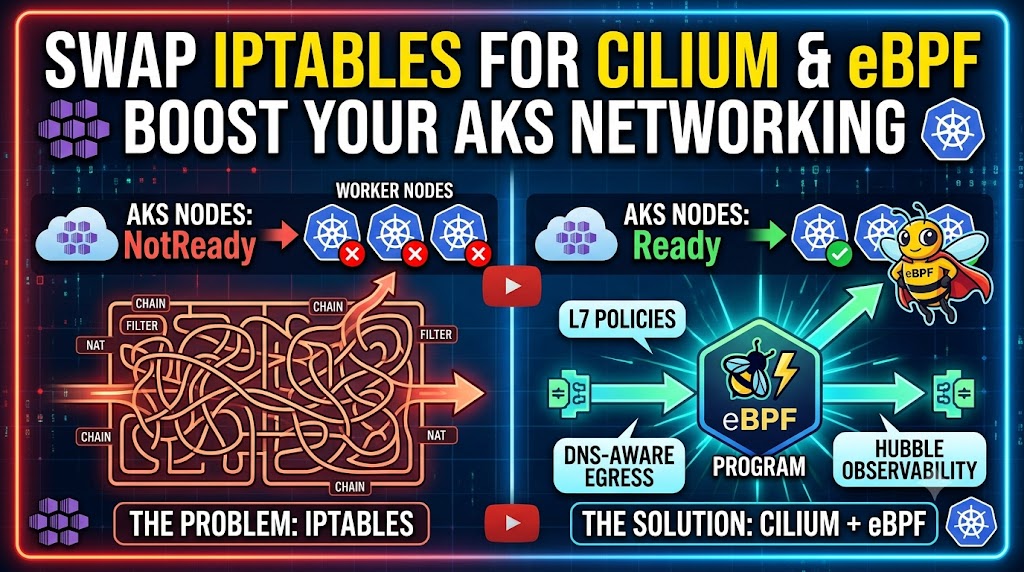
What happens when you deploy AKS with networkPlugin: none, when customer-managed Cilium is justified over Azure CNI Powered by Cilium, and how to operate its eBPF dataplane, policies, and Hubble observability.
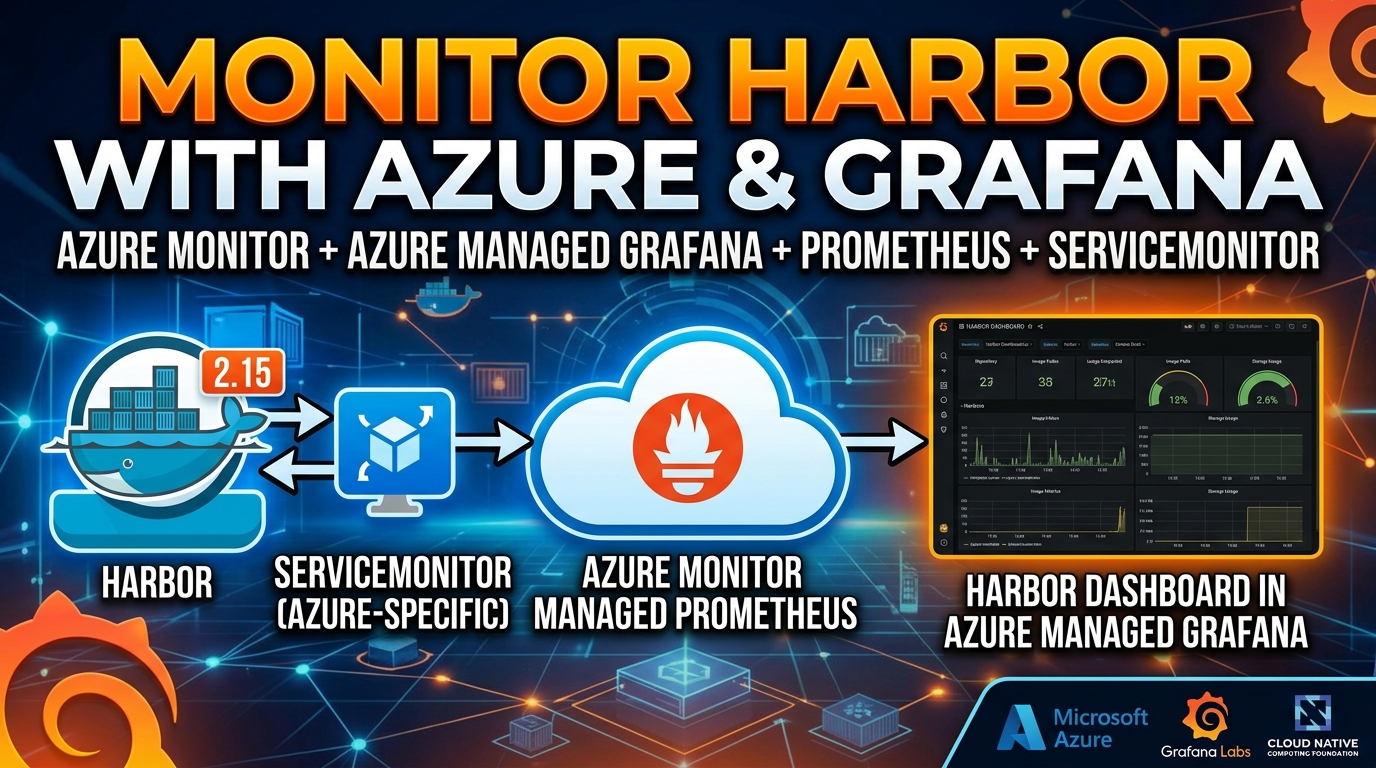
Collect Harbor 2.15 metrics with an Azure-specific ServiceMonitor, verify ingestion in Azure Monitor managed Prometheus, and build a Harbor dashboard in Azure Managed Grafana.
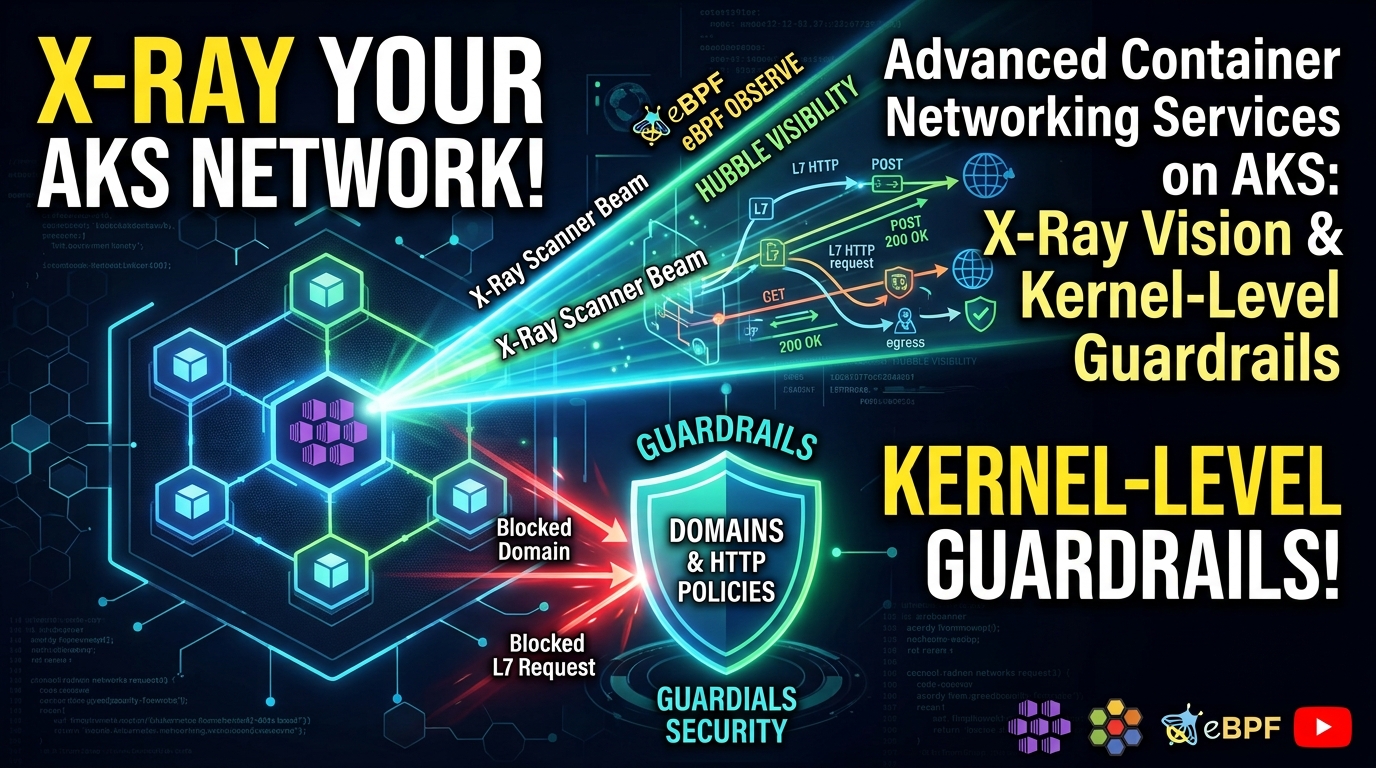
What Advanced Container Networking Services (ACNS) actually gives you on AKS — eBPF-powered network observability with Hubble, domain-based egress filtering, and HTTP-aware Layer 7 policies — explained through a hands-on demo you can run yourself.
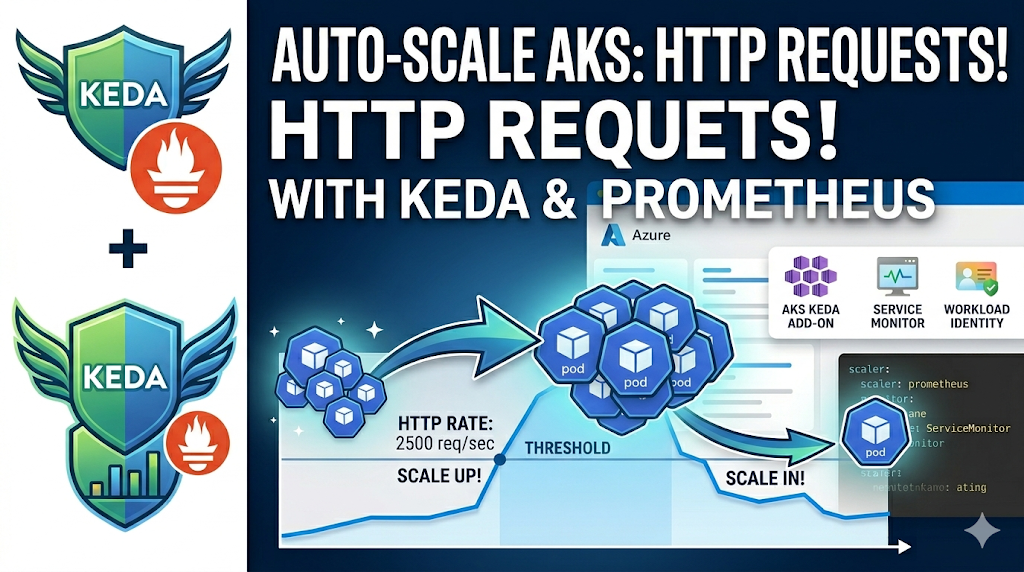
A hands-on demo using the AKS KEDA add-on and Azure Managed Prometheus to autoscale a Deployment on HTTP request rate. Covers the Prometheus scaler, ServiceMonitor scraping, Workload Identity authentication, and watching pods scale out and back in.