

Why Harbor Audit Logs Need Help
Harbor records an audit event for every login, project or member change, artifact push, pull and delete, and configuration change. That is exactly the kind of trail a security or compliance review wants to query centrally — but Harbor only writes those events to its internal Postgres audit_log table. They never touch stdout.
That matters because Azure Monitor Container Insights (the ama-logs DaemonSet already running on every AKS node) only ever looks at one thing: each container’s stdout/stderr, captured by the runtime into /var/log/containers/*.log. If a component never prints to stdout, Container Insights has nothing to tail, no matter how “enabled” it is on the cluster.
So Harbor’s audit trail sits in Postgres, queryable only through the Harbor UI’s own audit view, invisible to Log Analytics, Sentinel, or any KQL-based tooling — unless something bridges the gap.
Prerequisites and Assumptions
This walkthrough builds on top of an existing setup rather than starting from scratch. Before following along, make sure the following are already in place:
- An AKS cluster with Harbor already installed, typically via the Harbor Helm chart, running in its own
harbornamespace. This post doesn’t cover installing Harbor itself — only adding audit forwarding on top of an existing deployment. - Azure Monitor Container Insights already enabled on the cluster, with the
ama-logsDaemonSet running and sendingContainerLogV2data to a Log Analytics workspace. If Container Insights isn’t enabled, there’s nothing to tail the forwarder’s stdout, and this approach won’t work. - Cluster access via
kubectland Helm, with permissions to apply manifests and upgrade the Harbor release in theharbornamespace. - Familiarity with editing the Harbor Helm chart’s
values.yaml, since the forwarding configuration is wired in throughcore.configureUserSettings, not through the Harbor UI. - Access to the Log Analytics workspace (or Azure Monitor Logs / Sentinel) to run the KQL queries shown later.
A couple of assumptions are baked into the design, worth calling out explicitly:
- It assumes no new Azure resources are wanted — no new Data Collection Rule, agent, or workspace. If a dedicated logging pipeline is acceptable, a direct exporter to Azure Monitor might be simpler.
- It assumes Container Insights’
stdoutcollection is enabled,harboris not inexclude_namespaces, andcontainerlog_schema_versionis"v2"— see Confirming Container Insights Will Pick It Up below. - It assumes the small added latency (roughly a minute) and the in-memory Fluent Bit buffer are acceptable for an audit trail where Postgres remains the authoritative source (
skip_audit_log_database: false).
Design Goal
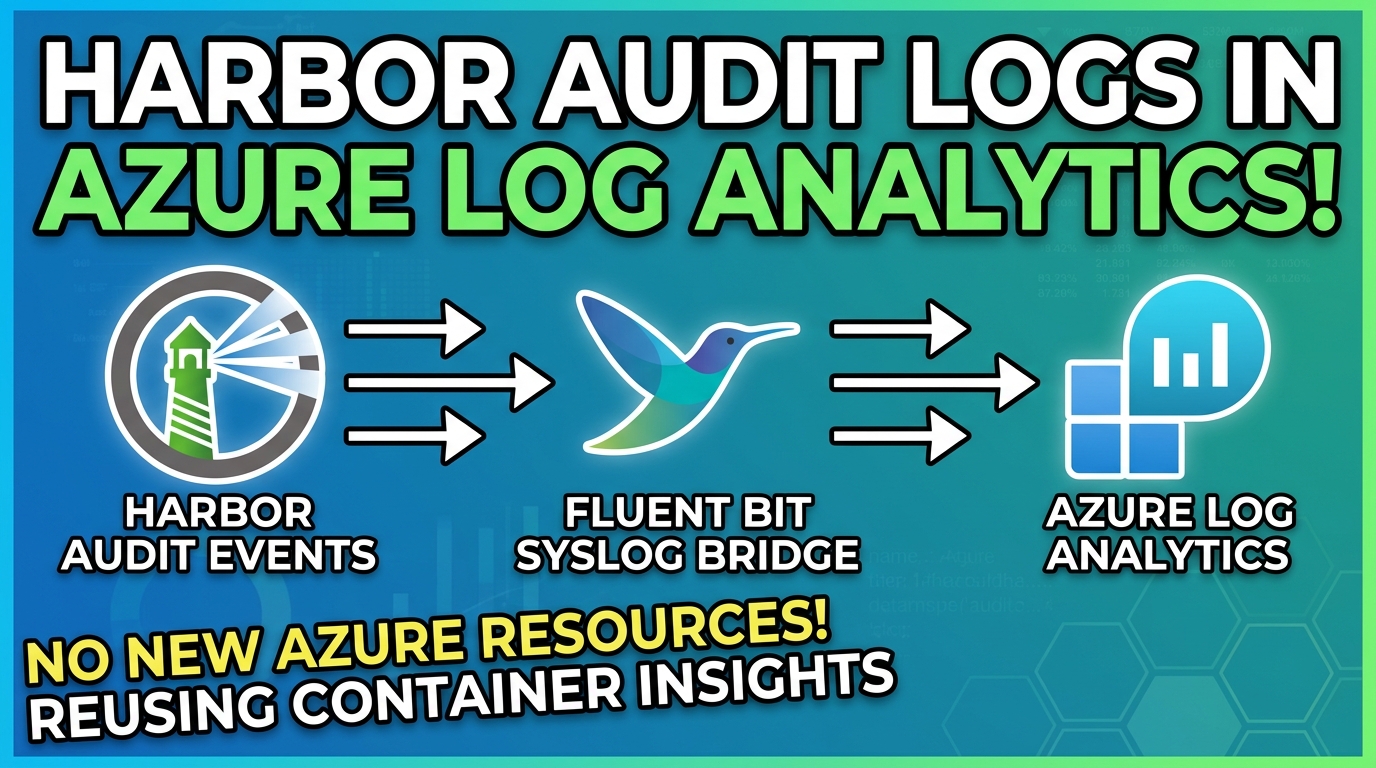
The goal here is narrow on purpose: get Harbor’s audit events into the Log Analytics workspace the cluster is already sending Container Insights data to, without provisioning a single new Azure resource — no new Data Collection Rule, no new agent, no new workspace. Container Insights is already enabled; the fix should ride on top of it.
That rules out anything that talks to Azure directly (a custom exporter with its own credentials, a second logging agent, and so on). Instead, the events need to become stdout of some container that’s already being tailed, and the mechanism should be small, stateless, and easy to reason about.
The Architecture
flowchart TD
    A["harbor-core<br/>audit_log_forward_endpoint"] -->|"TCP syslog :10514"| B["harbor-audit-forwarder<br/>(Fluent Bit)"]
    B -->|"stdout (fd 1)"| C["containerd<br/>CRI log writer"]
    C -->|"writes"| D["/var/log/containers/*.log<br/>on the node"]
    E["ama-logs DaemonSet<br/>(kube-system)"] -->|"tails via hostPath"| D
    E -->|"DCR + addon identity"| F["Log Analytics workspace<br/>ContainerLogV2"]
Harbor’s core component can already stream every audit event over TCP syslog to an external endpoint. A one-container Fluent Bit Deployment listens on that endpoint, and instead of forwarding the events anywhere external, it simply re-emits them to its own stdout. From there, the existing pipeline takes over: containerd writes that stdout to a CRI-format log file on the node, ama-logs tails it like any other container log, and it lands in ContainerLogV2 in the platform Log Analytics workspace.
No new Azure resource. Just one small Deployment that turns “a TCP stream Harbor already supports” into “a stdout stream Container Insights already watches.”
The Fluent Bit Forwarder
The forwarder is a ConfigMap, a Deployment, and a ClusterIP Service — nothing else.
The ConfigMap defines the Fluent Bit pipeline:
apiVersion: v1
kind: ConfigMap
metadata:
  name: harbor-audit-forwarder
  namespace: harbor
  labels:
    app.kubernetes.io/name: harbor-audit-forwarder
    app.kubernetes.io/component: audit-logging
    app.kubernetes.io/part-of: harbor
data:
  fluent-bit.conf: |
    [SERVICE]
        Daemon        Off
        Flush         1
        Log_Level     info
        HTTP_Server   On
        HTTP_Listen   0.0.0.0
        HTTP_Port     2020
        Health_Check  On

    # Harbor's syslog writer emits newline-delimited RFC3164-style frames. Using
    # the raw `tcp` input with `Format none` keeps the pipeline working even if
    # Harbor changes its framing; the line is parsed at query time in KQL
    # instead of at ingest time.
    [INPUT]
        Name          tcp
        Listen        0.0.0.0
        Port          10514
        Format        none
        Tag           harbor.audit
        Mem_Buf_Limit 10MB

    [FILTER]
        Name   record_modifier
        Match  harbor.audit
        Record log_source harbor-audit

    [OUTPUT]
        Name             stdout
        Match            harbor.audit
        Format           json_lines
        json_date_key    time
        json_date_format iso8601
The [INPUT] accepts a raw TCP stream and treats each newline-delimited frame as an opaque line — no attempt is made to parse Harbor’s syslog framing at ingest time, which makes the pipeline resilient to minor formatting changes. The [OUTPUT] writes one JSON object per line to stdout. That Format json_lines choice is deliberate and comes back later when querying: it means ContainerLogV2.LogMessage — a dynamic column — stores each line as structured JSON rather than a flat string, so Audit.log and Audit.log_source become directly addressable in KQL.
The Deployment runs the container hardened and minimal:
apiVersion: apps/v1
kind: Deployment
metadata:
  name: harbor-audit-forwarder
  namespace: harbor
  labels:
    app.kubernetes.io/name: harbor-audit-forwarder
    app.kubernetes.io/component: audit-logging
    app.kubernetes.io/part-of: harbor
spec:
  replicas: 1
  selector:
    matchLabels:
      app.kubernetes.io/name: harbor-audit-forwarder
  template:
    metadata:
      labels:
        app.kubernetes.io/name: harbor-audit-forwarder
        app.kubernetes.io/component: audit-logging
        app.kubernetes.io/part-of: harbor
    spec:
      automountServiceAccountToken: false
      securityContext:
        runAsNonRoot: true
        runAsUser: 65532
        runAsGroup: 65532
        seccompProfile:
          type: RuntimeDefault
      containers:
      - name: fluent-bit
        image: docker.io/fluent/fluent-bit:4.0.5
        args:
        - --config=/fluent-bit/etc/conf/fluent-bit.conf
        ports:
        - name: syslog
          containerPort: 10514
          protocol: TCP
        - name: http
          containerPort: 2020
          protocol: TCP
        securityContext:
          allowPrivilegeEscalation: false
          readOnlyRootFilesystem: true
          capabilities:
            drop:
            - ALL
        resources:
          requests:
            cpu: 25m
            memory: 32Mi
          limits:
            cpu: 200m
            memory: 128Mi
        livenessProbe:
          httpGet:
            path: /api/v1/health
            port: http
          initialDelaySeconds: 10
          periodSeconds: 30
        readinessProbe:
          httpGet:
            path: /api/v1/health
            port: http
          initialDelaySeconds: 5
          periodSeconds: 10
        volumeMounts:
        - name: config
          mountPath: /fluent-bit/etc/conf
          readOnly: true
        - name: tmp
          mountPath: /tmp
      volumes:
      - name: config
        configMap:
          name: harbor-audit-forwarder
      - name: tmp
        emptyDir: {}
---
apiVersion: v1
kind: Service
metadata:
  name: harbor-audit-forwarder
  namespace: harbor
  labels:
    app.kubernetes.io/name: harbor-audit-forwarder
    app.kubernetes.io/component: audit-logging
    app.kubernetes.io/part-of: harbor
spec:
  type: ClusterIP
  selector:
    app.kubernetes.io/name: harbor-audit-forwarder
  ports:
  - name: syslog
    port: 10514
    targetPort: syslog
    protocol: TCP
Non-root, read-only root filesystem, all capabilities dropped, no service account token — there is no reason for a stdout re-emitter to need any of those, and Fluent Bit’s health check endpoint at /api/v1/health gives Kubernetes real liveness and readiness signals instead of just “is the process alive.”
The Myth to Bust: There Is No Plain Container Environment Variable for This
Here is the part that costs the most time if you don’t know it going in: there is no container environment variable that turns this on directly. Setting the config key’s name as a plain environment variable on the core container has no effect whatsoever — no error, no warning, nothing in the logs. It is a plausible-looking dead end.
audit_log_forward_endpoint and skip_audit_log_database are real Harbor settings, but they are user-scope system settings — the same category as auth mode or self-registration, visible under Administration → Configuration in the Harbor UI. Harbor gives you exactly three ways to set a user-scope setting:
- The Harbor UI.
PUT /api/v2.0/configurations.- The declarative
CONFIG_OVERWRITE_JSONenvironment variable, read once whencorestarts.
For a GitOps-style deployment, option 3 is the only one that doesn’t require a manual step after every install. The Harbor Helm chart exposes it through core.configureUserSettings in values.yaml:
core:
  configureUserSettings: |
    {
      "audit_log_forward_endpoint": "harbor-audit-forwarder.harbor.svc.cluster.local:10514",
      "skip_audit_log_database": false
    }
That JSON blob is rendered into CONFIG_OVERWRITE_JSON for the core container. Two consequences are worth knowing before you rely on this:
- Every Harbor user setting becomes read-only while
CONFIG_OVERWRITE_JSONis set — not just the two keys above. Auth mode, self-registration, project creation restriction, retention policy, all of it can then only be changed by editingvalues.yamland redeploying; the API rejects writes withcurrent config is init by env variable: CONFIG_OVERWRITE_JSON, it cannot be updated. Settings you don’t list in the JSON simply keep whatever value they already had. harbor-corewill not start if the forwarder is unreachable. On startup, Harbor dialsaudit_log_forward_endpointand treats a failed connection as fatal —coreexits rather than starting up with forwarding silently disabled. That single fact drives the next section.
skip_audit_log_database: false is a deliberate choice, not an oversight: it keeps Harbor’s own Postgres audit_log table (and the Harbor UI’s audit view) as the authoritative record, with Log Analytics as an additional, queryable copy — not a replacement.
Deployment Order Is a Hard Requirement
Because harbor-core exits if it can’t reach the forwarder at startup, the forwarder isn’t an optional add-on you bolt on afterward — it has to exist and be ready before Harbor’s core container starts for the first time, and before every restart after that.
# 1. Apply the forwarder first and wait for it to be ready
kubectl apply -f audit-log-forwarder.yaml
kubectl rollout status deployment/harbor-audit-forwarder \
  -n harbor --timeout=180s

# 2. Only then install or upgrade Harbor
helm upgrade --install harbor harbor/harbor \
  --namespace harbor \
  --values values.yaml
If you ever need to break this dependency — for example, to debug Harbor without the forwarder in the picture — remove configureUserSettings from values.yaml and redeploy. That reverts audit forwarding to disabled without touching anything else.
Confirming Container Insights Will Pick It Up
Once the forwarder is writing JSON lines to stdout, three settings in the cluster’s Container Insights configuration determine whether those lines actually reach Log Analytics:
[log_collection_settings.stdout] enabled = true- The
harbornamespace is not listed inexclude_namespaces containerlog_schema_version = "v2"
The middle one is the sharpest edge here: adding harbor to exclude_namespaces silently kills the audit trail. There’s no error, no warning in the agent logs — the events simply stop appearing in ContainerLogV2, and unless you’re actively watching for them, you won’t notice until you need them.
Verifying End to End
Start with the forwarder itself:
kubectl get deployment harbor-audit-forwarder -n harbor
kubectl logs deployment/harbor-audit-forwarder -n harbor --tail=20
Generate a real event — log in to the Harbor UI, or create a test project — and check whether the forwarder’s logs pick it up.
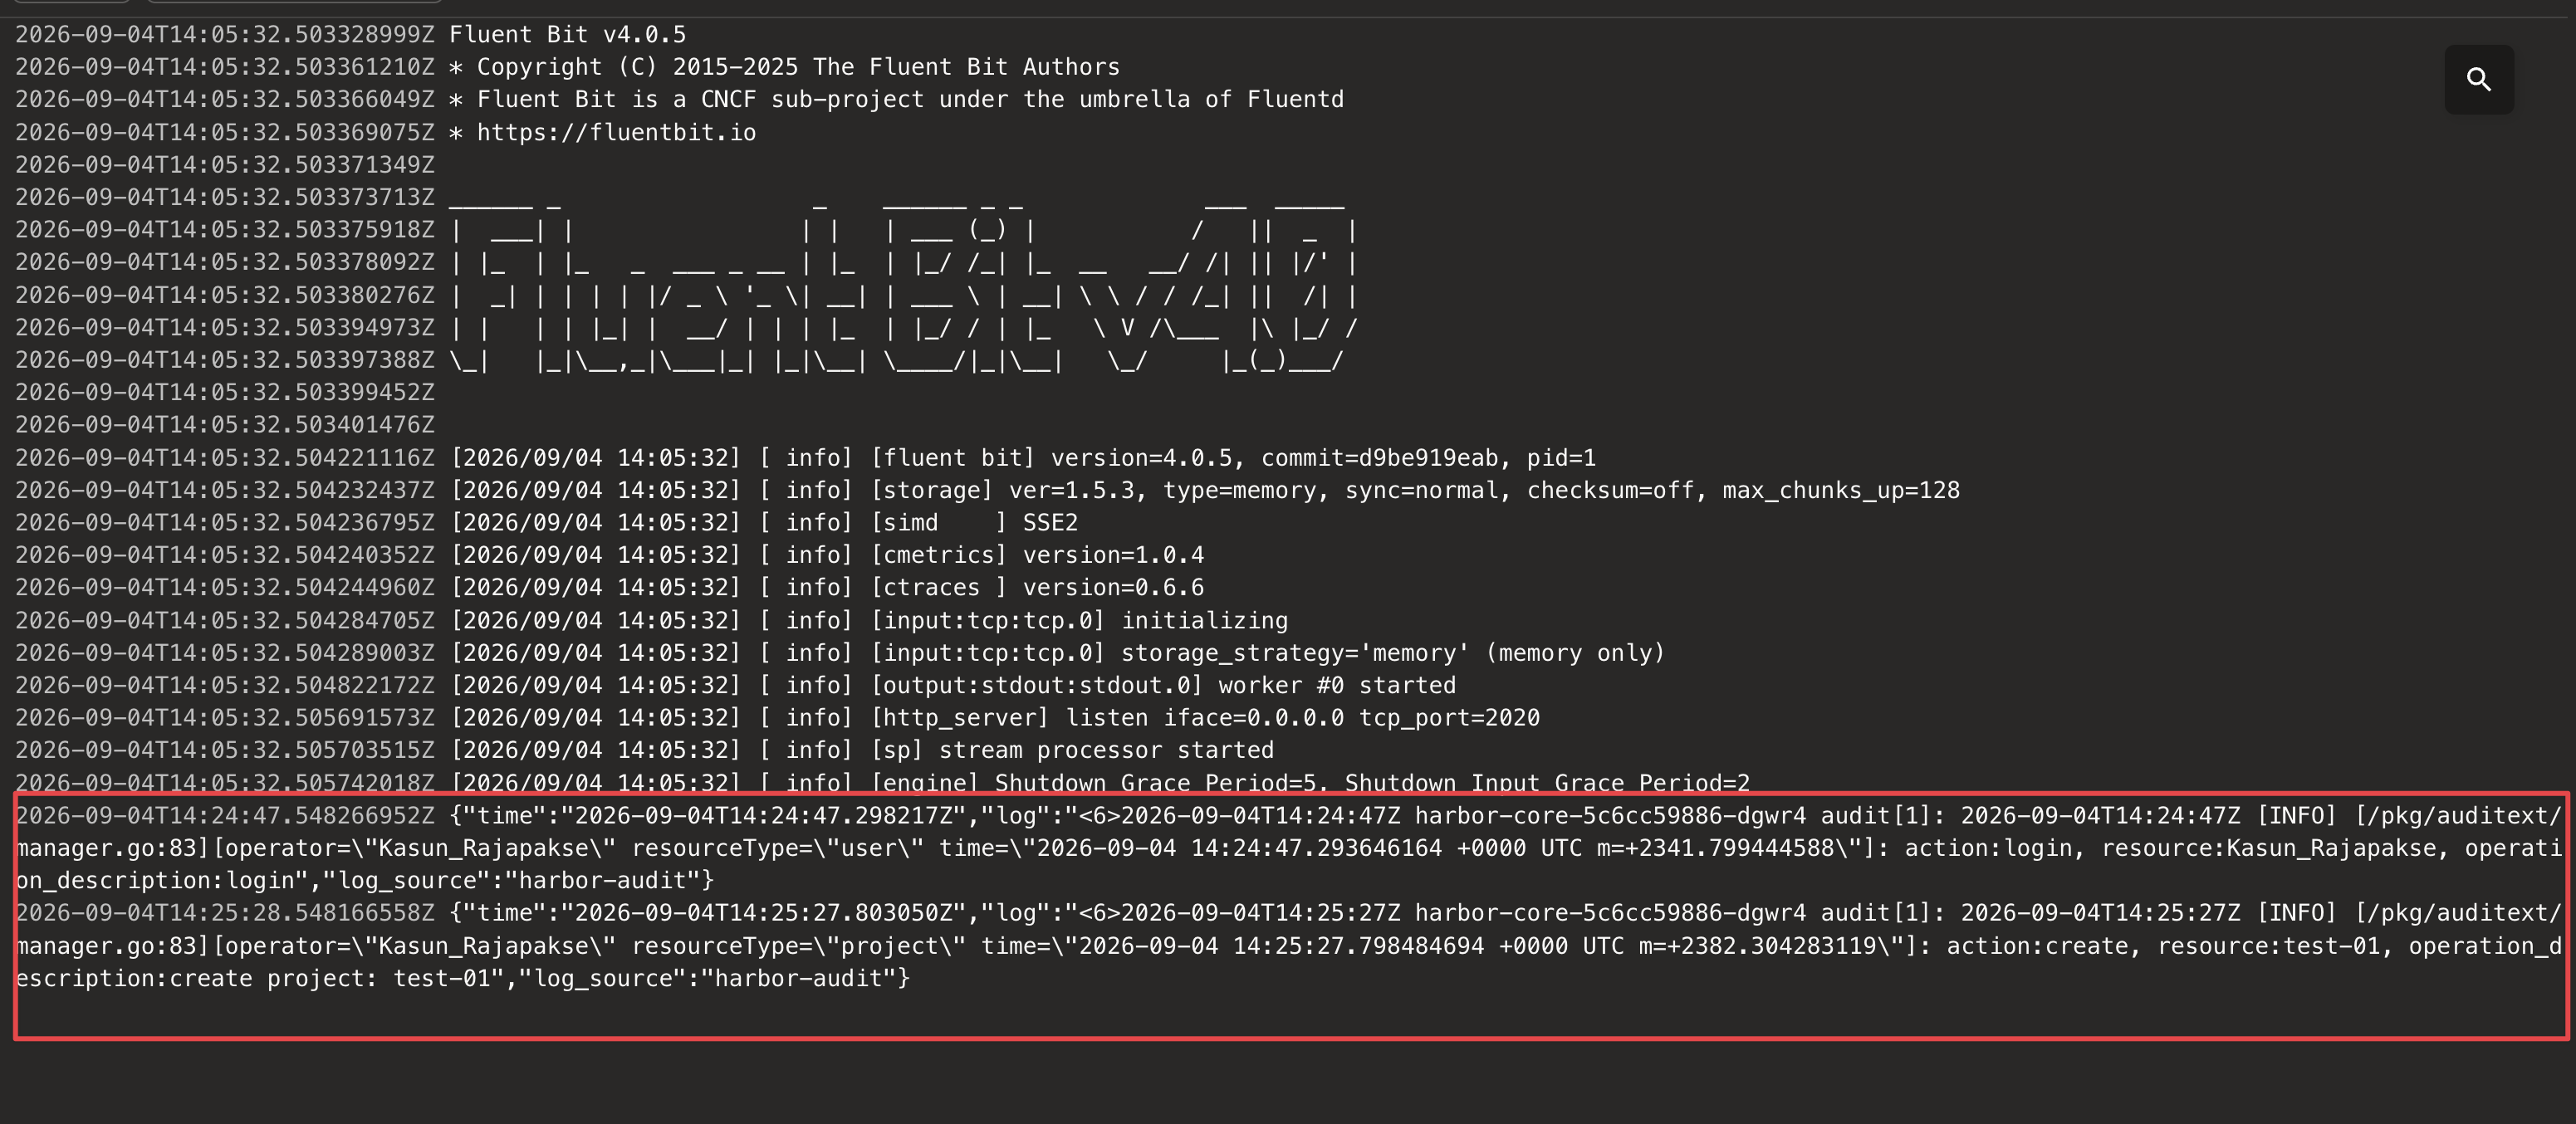
If the forwarder logs stay empty, check what Harbor actually has configured. Query core’s live configuration directly:
kubectl exec -n harbor deploy/harbor-core -- sh -c \
  'curl -sS -u admin:"$HARBOR_ADMIN_PASSWORD" \
     http://127.0.0.1:8080/api/v2.0/configurations' \
  | python3 -c "import sys,json; print(json.load(sys.stdin)['audit_log_forward_endpoint'])"
An empty value here means CONFIG_OVERWRITE_JSON never reached core — double-check that core.configureUserSettings is actually present in the values passed to Helm.
If harbor-core is crash-looping instead, that points the other way — the forwarder is probably unreachable and Harbor is failing its fatal startup check. Check the core logs for the audit-endpoint error:
kubectl logs deploy/harbor-core -n harbor | grep -i 'CONFIG_OVERWRITE_JSON\|audit endpoint'Finally, to prove the Fluent Bit pipeline works independently of Harbor entirely, send it a raw test line directly:
kubectl run tcptest -n harbor --rm -i --restart=Never --image=busybox:1.36 -- \
  sh -c 'echo "<14>test line" | nc -w 2 harbor-audit-forwarder 10514'

kubectl logs deployment/harbor-audit-forwarder -n harbor --tail=5
If that test line shows up in the forwarder’s logs, the Fluent Bit side is healthy and any remaining problem is on Harbor’s side of the connection.
Querying the Audit Trail in Log Analytics
A forwarded event looks roughly like this on the wire — a syslog-style prefix wrapping Harbor’s own audit log line:
<6>2026-09-02T13:53:27Z harbor-core-7755896b5b-k5d8r audit[1]: 2026-09-02T13:53:27Z [INFO]
[/pkg/auditext/manager.go:83][operator="admin" resourceType="project"
time="2026-09-02 13:53:27.000516658 +0000 UTC"]: action:create,
resource:audit-smoke-test, operation_description:create project: audit-smoke-test
Since Fluent Bit wraps that whole line in a JSON envelope, the raw event is available under LogMessage.log:
ContainerLogV2
| where PodNamespace == "harbor" and ContainerName == "fluent-bit"
| extend Audit = parse_json(LogMessage)
| where isnotempty(Audit.log)
| project TimeGenerated, AuditEvent = tostring(Audit.log)
| order by TimeGenerated desc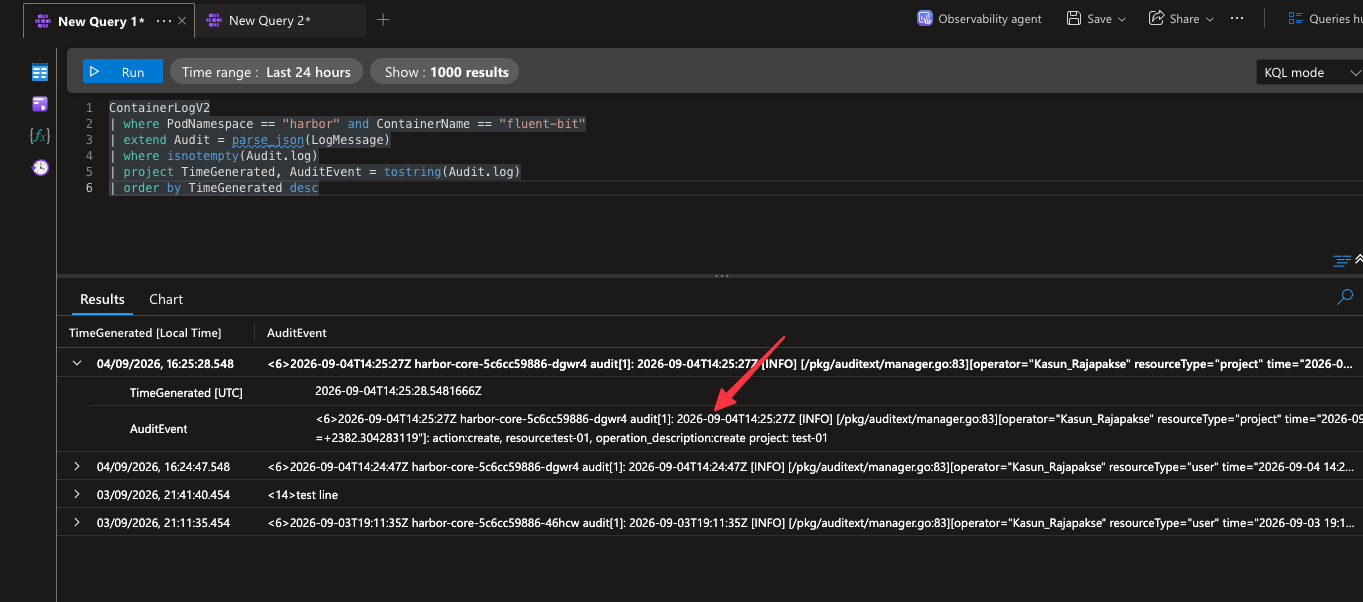
From there, parse pulls out the individual fields at query time:
ContainerLogV2
| where PodNamespace == "harbor" and ContainerName == "fluent-bit"
| extend AuditEvent = tostring(parse_json(LogMessage).log)
| where AuditEvent has "operator="
| parse AuditEvent with * 'operator="' Operator '"' *
                       'resourceType="' ResourceType '"' *
                       ']: action:' Action ', resource:' Resource ','
                       ' operation_description:' Description
| project TimeGenerated, Operator, Action, ResourceType, Resource, Description
| order by TimeGenerated desc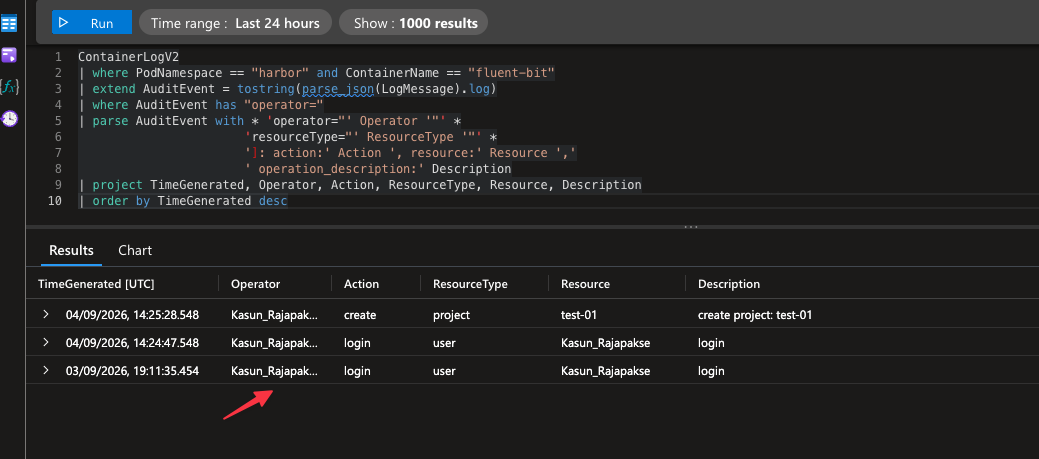
Or roll it up into an activity summary per user:
ContainerLogV2
| where PodNamespace == "harbor" and ContainerName == "fluent-bit"
| extend AuditEvent = tostring(parse_json(LogMessage).log)
| parse AuditEvent with * 'operator="' Operator '"' *
| summarize Events = count() by Operator, bin(TimeGenerated, 1h)
That last query is a reasonable starting point for a “who did what, how often” dashboard tile, or as the basis for an alert on unusual activity from a given operator.
Operational Caveats
A few things are worth knowing before treating this as a fully reliable audit pipeline:
- The forwarder’s buffer is small and in-memory. Fluent Bit’s
Mem_Buf_Limitis set to 10MB. If the forwarder pod restarts, anything buffered is lost, andharbor-core’s syslog writes fail during the gap.skip_audit_log_database: falseis the safety net here — Postgres stays authoritative, so nothing is truly lost, only delayed in reaching Log Analytics. - Expect roughly a minute of latency, not real time. Fluent Bit’s flush interval is 1 second, but the Azure Monitor agent does its own batching on top of that — events typically show up in
ContainerLogV2within about a minute, not instantly. - Delivery is fire-and-forget. Writing to stdout has no acknowledgment, no retry, and no backpressure. If containerd or the agent falls behind, there’s no signal back to Fluent Bit or Harbor.
- The startup dependency cuts both ways. The same fatal check that guarantees you’ll notice if the forwarder is missing also means an unrelated forwarder outage can block a
harbor-corerestart. Keep that in mind during cluster maintenance that might affect theharbornamespace.
Wrap-Up
The interesting part of this setup isn’t Fluent Bit’s configuration — it’s the realization that Container Insights doesn’t need a new resource, a new agent, or a new pipeline to pick up a new kind of log. It only needs the data to appear as stdout on a container it’s already watching. Once that clicked, the entire solution reduced to “make Harbor’s audit stream visible on stdout somewhere,” and Fluent Bit is a small, well-understood way to do that.
The other lesson is to treat CONFIG_OVERWRITE_JSON as the real configuration surface for anything beyond the Harbor Helm chart’s first-class values — and to read the fine print, since it makes the entire configuration read-only, not just the keys you set.
If you’re also collecting Harbor’s Prometheus metrics on Azure Monitor, see Monitoring Harbor with Azure Monitor and Azure Managed Grafana for the companion setup — metrics and audit logs together cover both “is Harbor healthy” and “who did what.”