

Every Kubernetes engineer has lived some version of this incident: a service starts timing out, the app team swears nothing changed, the dashboards show CPU and memory are fine, and after two hours of guessing someone finally mutters the ancient incantation — “it’s probably DNS.”
It usually is. But here is the uncomfortable part: on a stock AKS cluster, you cannot prove it. Pod-to-pod traffic disappears into a maze of veth pairs, NAT, and overlay encapsulation. There is no access log for the CNI. A NetworkPolicy that silently drops packets looks identical to a broken application. Kubernetes networking is a black box, and you are debugging it by shaking it and listening.
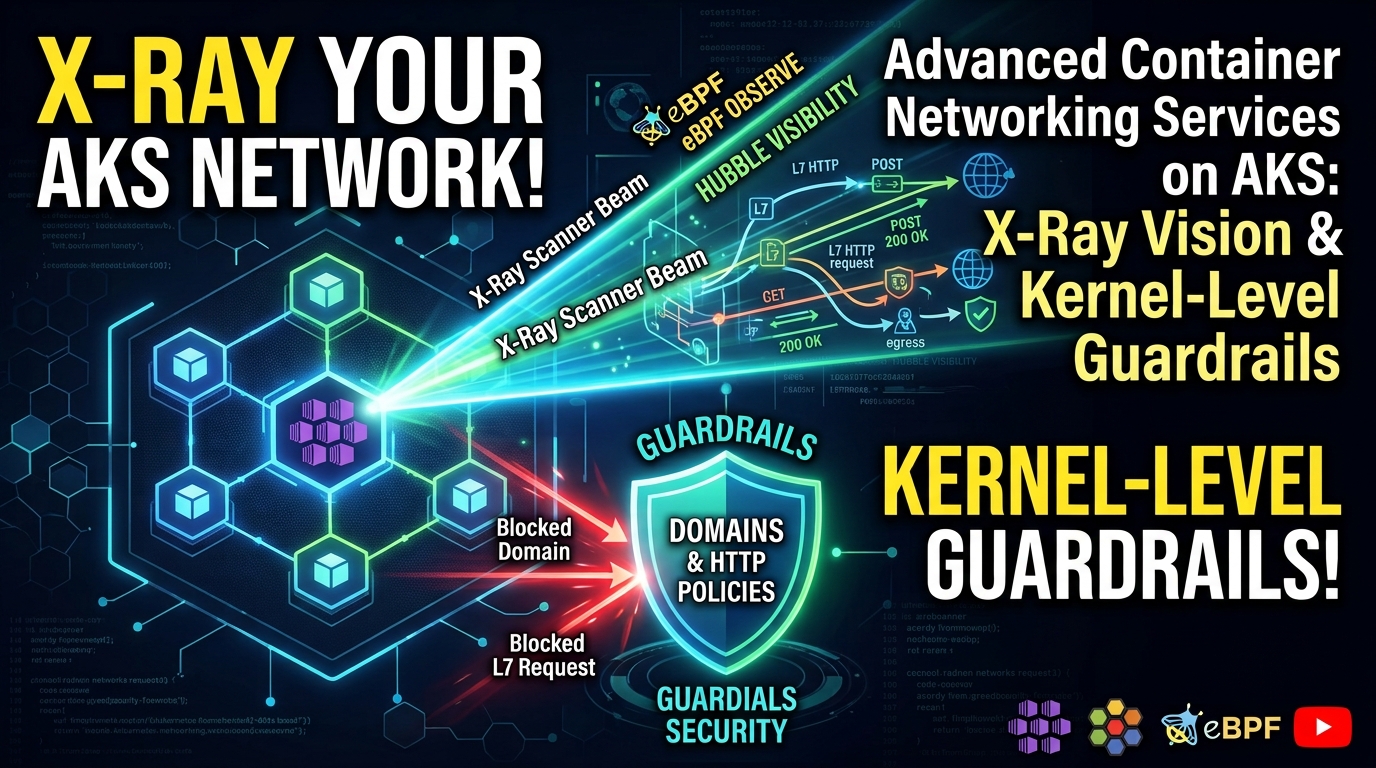
Advanced Container Networking Services (ACNS) is Microsoft’s attempt to crack that box open. It uses eBPF — small programs that run inside the Linux kernel itself — to watch, filter, and measure every packet your workloads send, without sidecars, without agents in your pods, and without changing a single line of application code.
In this post I want to explain what ACNS actually gives you, why the architecture is interesting, and then prove it works with three hands-on experiments: catching dropped flows in real time, blocking egress by domain name, and rejecting HTTP requests by method and path.
📖 References:
The mental model: a camera, a bouncer, and a turbocharger
ACNS is really three feature sets bundled under one flag. I find them easiest to remember as roles:
| Role | ACNS feature set | What it does | Works with |
|---|---|---|---|
| 📹 The camera | Container Network Observability | Records every flow — who talked to whom, on which port, and whether it succeeded — as Hubble metrics and flow logs | Any Azure CNI (Cilium and non-Cilium) |
| 🚪 The bouncer | Container Network Security | Enforces policy by domain name (FQDN) and by HTTP method/path (L7), plus WireGuard/mTLS encryption | Azure CNI Powered by Cilium only |
| ⚡ The turbocharger | Container Network Performance | eBPF host routing that bypasses chunks of the iptables stack to cut east-west latency | Azure CNI Powered by Cilium only |
The common thread is eBPF. Instead of forcing traffic through userspace proxies or sidecar containers, ACNS loads programs directly into the kernel’s networking path. The kernel was going to process every packet anyway — eBPF just lets it take notes (observability) and say no (security) while it does.
Two consequences of that design are worth internalizing:
- Zero application changes. No SDKs, no sidecar injection, no restarts to get visibility. The kernel sees everything by definition.
- Drops are cheap and early. A packet denied by an eBPF policy dies in-kernel before it ever touches the wire. Compare that to a userspace firewall that has to receive the packet first.
The one exception is Layer 7 policy: eBPF cannot parse HTTP semantics economically, so an eBPF probe on the source pod’s interface marks matched packets and redirects them to a node-local Envoy proxy. That Envoy ships as part of the ACNS security agent and runs as its own DaemonSet, decoupled from the Cilium agent — one shared proxy per node, not a sidecar per pod.
Where the data lands
The camera is useless without a screen. ACNS ships its Hubble metrics to Azure Monitor managed Prometheus, and Azure provides prebuilt Managed Grafana dashboards for cluster traffic, drops, DNS, and per-workload breakdowns. For real-time work there is the Hubble CLI, which is essentially tcpdump that speaks Kubernetes — it shows flows labeled with namespaces, pods, and policy verdicts instead of raw IPs.
The lab
To play with this I built a small demo environment — one command, everything included:
git clone https://github.com/kasunsjc/Code-Snippets.git
cd Code-Snippets/AKS-ACNS-Cilium-Terraform
./deploy.sh
That provisions an AKS cluster running Azure CNI in overlay mode with the Cilium data plane, ACNS observability and security enabled, ACNS already in L7 policy mode, a Managed Prometheus workspace, and a Managed Grafana instance already wired to the right dashboards. The older --enable-l7 argument remains as a no-op safety net, but is no longer needed. (The environment happens to use Terraform under the hood — the details, variables, and manifests are all in the repo if you want to dig in.)
The part that actually matters — the switch that turns all of this on — is a single block in the cluster’s network profile:
network_profile {
  network_plugin      = "azure"
  network_plugin_mode = "overlay"
  network_data_plane  = "cilium"
  network_policy      = "cilium"

  advanced_networking {
    observability_enabled = true
    security_enabled      = true
  }
}
That is the entire ACNS enablement story. Two booleans. (The Azure CLI equivalent is --enable-acns on az aks create/update, which enables FQDN filtering policies by default; for L7 you additionally set --acns-advanced-networkpolicies L7.) The azurerm Terraform provider does not expose that L7 mode setting yet, so the demo flips advancedNetworkPolicies: "L7" via the ARM API. The result is ACNS in L7 mode end-to-end: L7 is a superset of FQDN filtering, so both security experiments work without another cluster update.
Requirements to know: observability works with any Azure CNI variant. On the Cilium data plane, ACNS (both observability and security) requires Kubernetes 1.29+, and the security features are available only with Azure CNI Powered by Cilium. Also note ACNS is a paid offering on top of your cluster costs.
Now let’s make it earn its keep.
Experiment 1: Actually seeing your network
The first thing I do on any new observability stack is generate traffic I understand, so I can verify the telemetry tells the truth. The demo repo ships manifests that use a shared traffic-demo namespace with three kinds of noise. All demo manifests are standardized to this namespace to avoid namespace confusion:
- pods making pod-to-pod HTTP calls (normal traffic)
- pods doing continuous external DNS lookups (the “it’s always DNS” simulator)
- pods attempting connections that are designed to fail (so the drop counters have something to count)
kubectl apply -f kubernetes-manifests/06-prometheus-hubble-metrics.yaml
kubectl apply -f kubernetes-manifests/01-traffic-demo.yaml
kubectl apply -f kubernetes-manifests/07-dns-traffic-generator.yaml
kubectl apply -f kubernetes-manifests/08-dns-metrics-trigger-policy.yaml
⚠️ The gotcha that will waste your afternoon
Notice the first manifest. Azure Monitor’s managed Prometheus runs a minimal-ingestion profile by default: it scrapes everything but keeps only an allowlist of metric names. Hubble flow metrics like hubble_flows_processed_total are high-cardinality, so they are not on that list — they get scraped and then silently thrown away.
The symptom is maddening: ACNS is enabled, the scrape targets are green, and the flow dashboards are empty. The fix is a ConfigMap that extends the keep-list for the networkobservabilityHubble and networkobservabilityCilium targets. That is exactly what 06-prometheus-hubble-metrics.yaml does. If you take one operational note away from this post, take this one.
The dashboards
Grafana is already wired up by the deployment — grab its URL from the Terraform output:
terraform -chdir=terraform output -raw grafana_endpointA few minutes after the traffic starts, Grafana (Dashboards → Azure Managed Prometheus) comes alive:
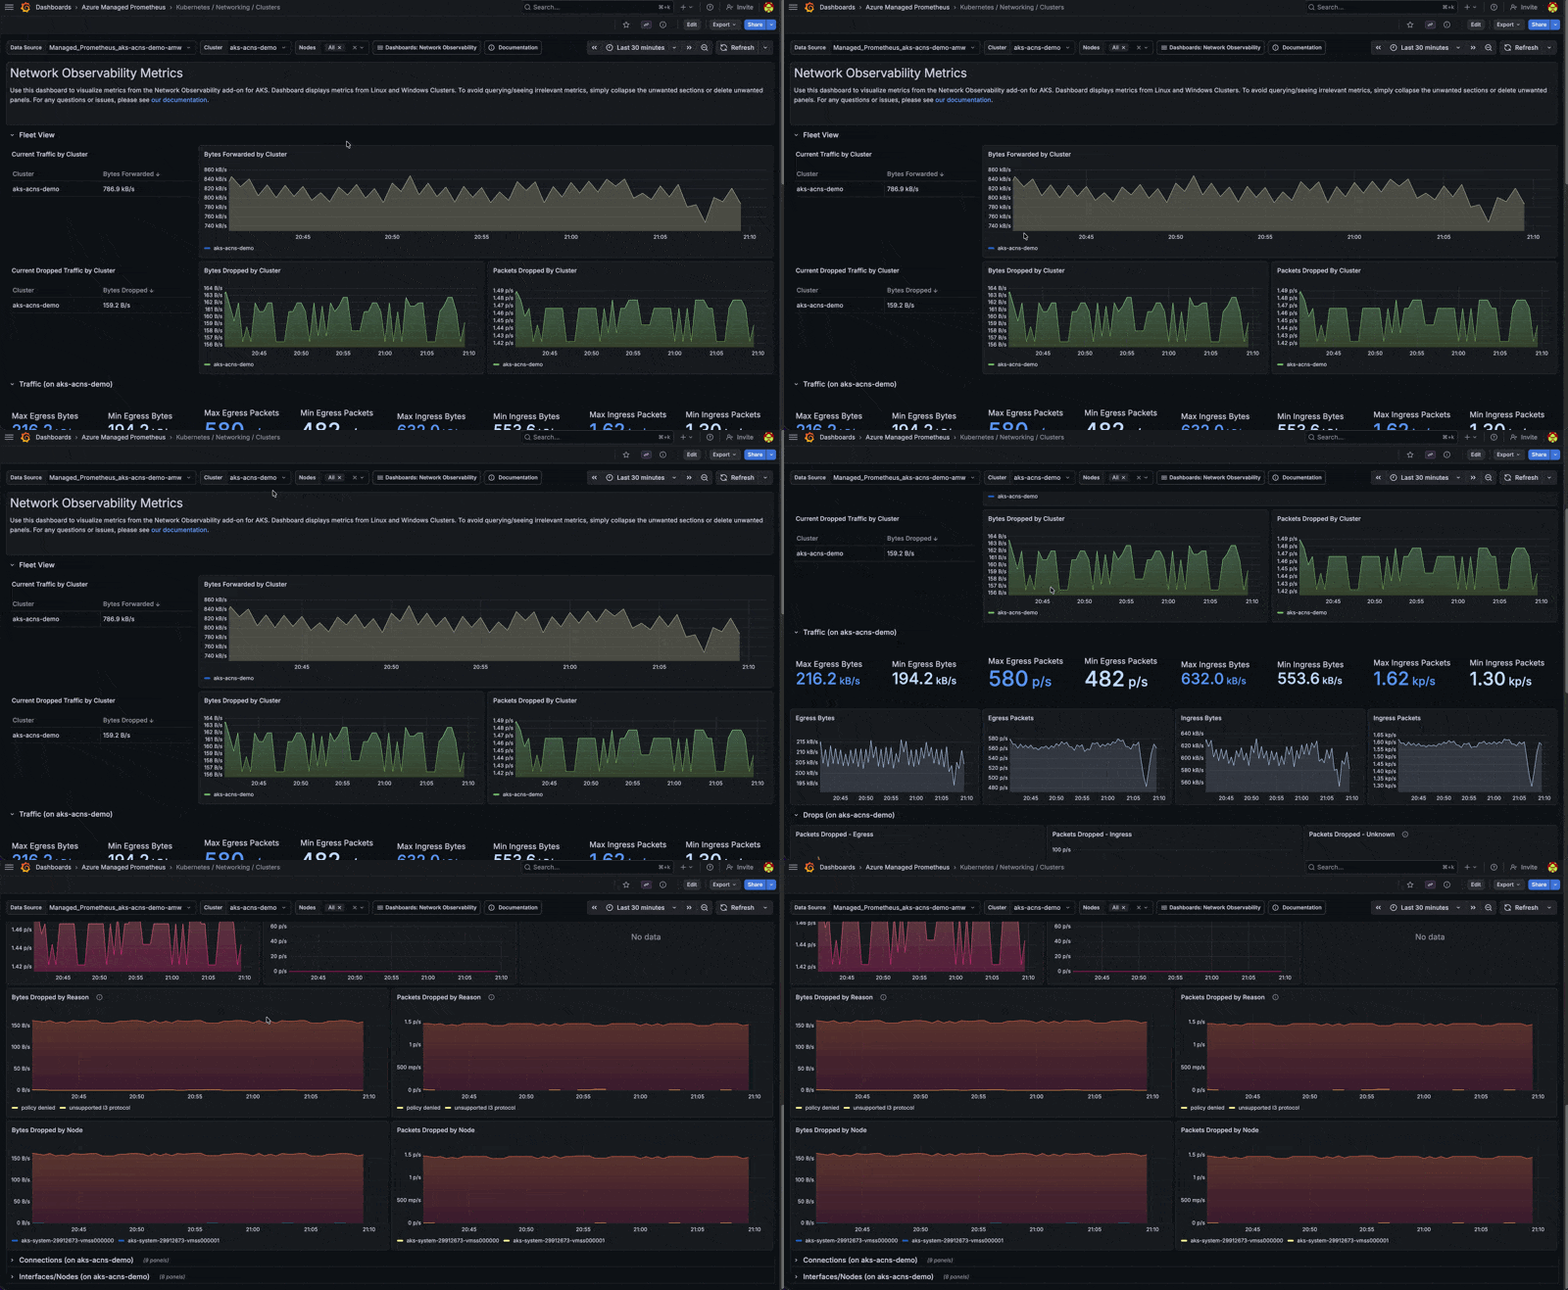
- Kubernetes / Networking / Clusters — cluster-wide traffic volume, drop counts, TCP connection states. This is your “is the network healthy at all” view.
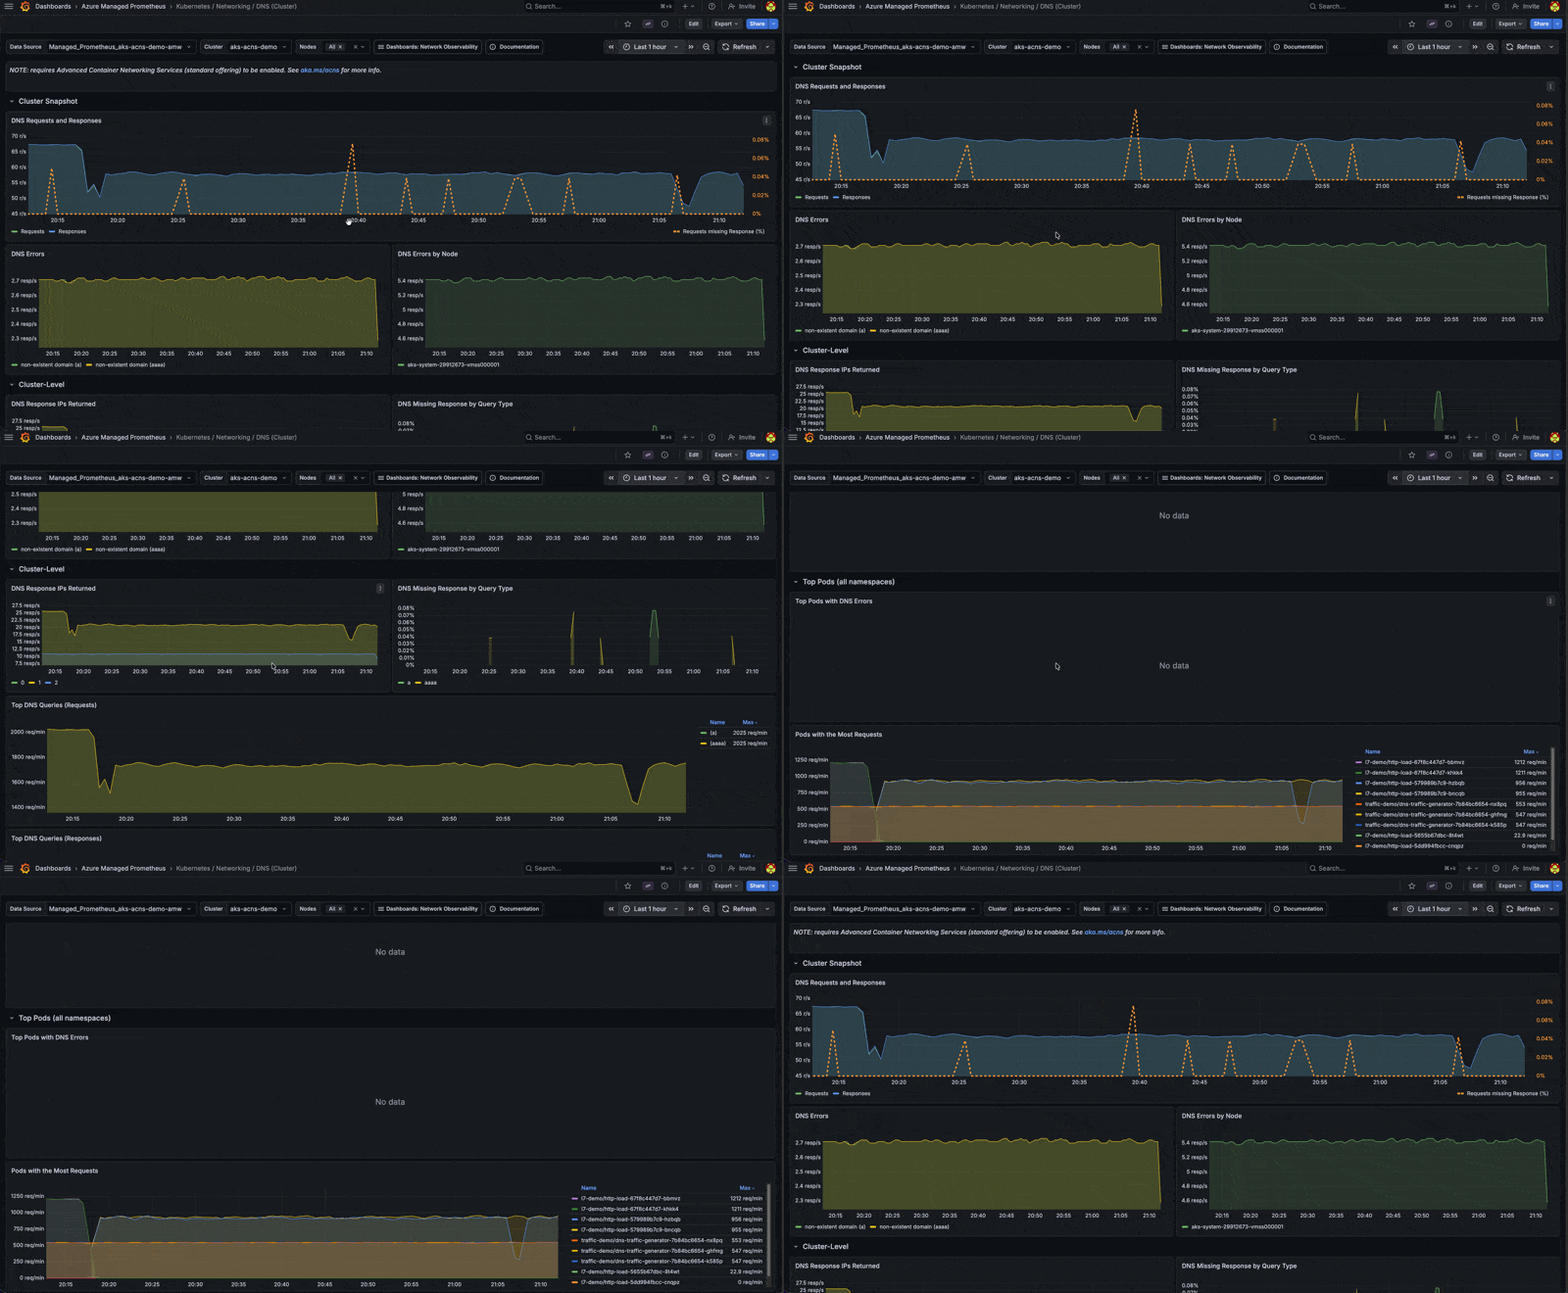
- Kubernetes / Networking / DNS (Cluster) and DNS (Workload) — request/response rates, error rates, and which lookups fail. The next time someone says “it’s probably DNS,” you answer with a chart.
- Kubernetes / Networking / Drops (Workload) — drops to and from a specific workload.
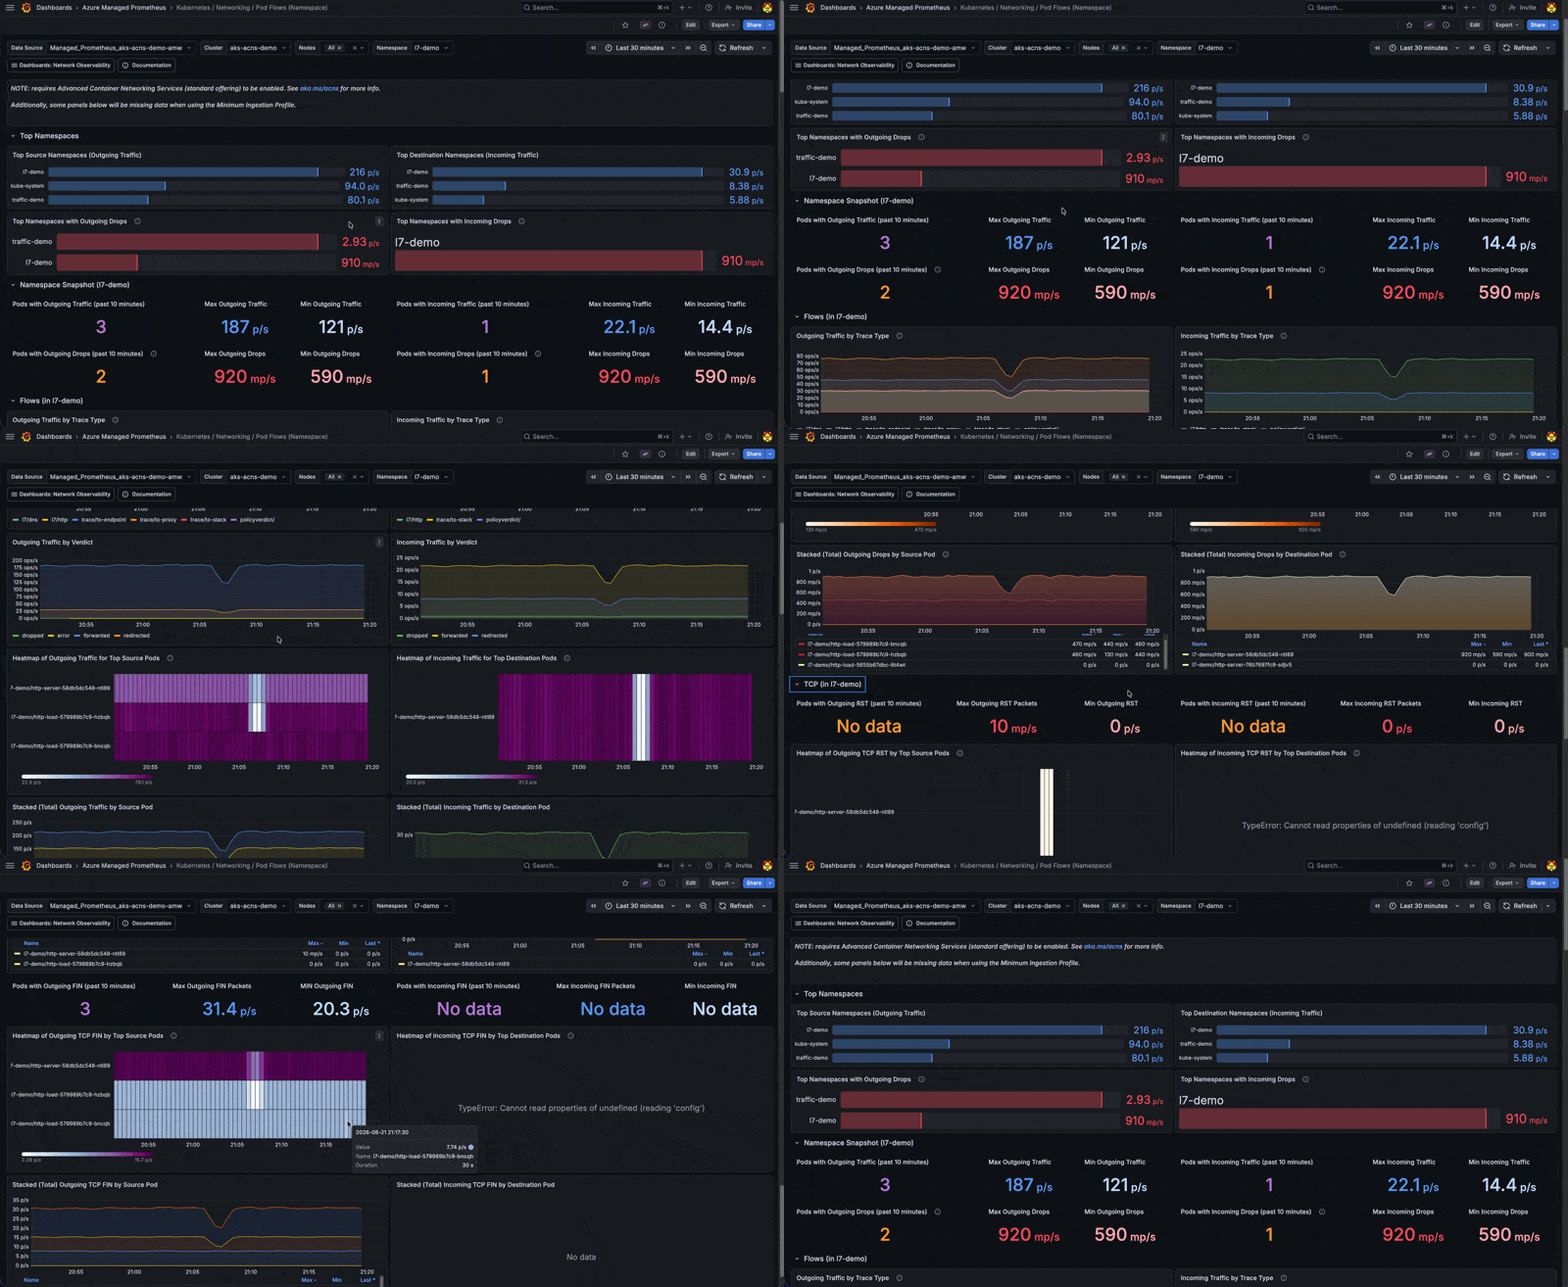
- Kubernetes / Networking / Pod Flows (Namespace) and Pod Flows (Workload) — L4/L7 packet flows and per-workload traffic breakdown.
On Cilium clusters, the DNS dashboards populate only when a Cilium FQDN/DNS network policy applies to the workload. The 08-dns-metrics-trigger-policy.yaml manifest provides that policy.
The flight recorder: Hubble CLI
Dashboards show trends; incidents need individual flows. The Hubble CLI connects to the cluster’s Hubble relay and streams live, Kubernetes-aware flow events.
One setup step people miss: the ACNS-managed relay requires mutual TLS. If you just port-forward and run hubble observe, the relay closes the connection and kubectl port-forward dies with a cryptic broken pipe. The client certificates already exist in the cluster — ACNS stores them in the hubble-relay-client-certs secret — you just need to export them and point the CLI at them:
# Port-forward the Hubble relay
kubectl port-forward -n kube-system svc/hubble-relay 4245:443 &

# Export the ACNS-managed Hubble client mTLS credentials
kubectl get secret hubble-relay-client-certs -n kube-system \
  -o jsonpath='{.data.tls\.crt}' | base64 -d > /tmp/hubble-client.crt
kubectl get secret hubble-relay-client-certs -n kube-system \
  -o jsonpath='{.data.tls\.key}' | base64 -d > /tmp/hubble-client.key
kubectl get secret hubble-relay-client-certs -n kube-system \
  -o jsonpath='{.data.ca\.crt}' | base64 -d > /tmp/hubble-ca.crt

# Configure the Hubble CLI for the relay's mTLS endpoint
hubble config set tls true
hubble config set tls-server-name instance.hubble-relay.cilium.io
hubble config set tls-ca-cert-files /tmp/hubble-ca.crt
hubble config set tls-client-cert-file /tmp/hubble-client.crt
hubble config set tls-client-key-file /tmp/hubble-client.key

# Confirm the CLI can reach the relay
hubble status
Once hubble status reports healthy, this is the command that changes how you debug:
hubble observe --verdict DROPPEDEvery flow the data plane refused, in real time, with the pod names and the reason. A misbehaving network policy stops being a ghost and becomes a log line:
traffic-demo/dns-error-generator-7d4b... -> kube-system/kube-dns:53
  DROPPED (Policy denied)
I have lost entire days to problems this one command answers in seconds.
Experiment 2: Firewall rules that speak human
Here is a policy requirement every security team eventually asks for: “this workload may only talk to api.partner.com, nothing else.”
Standard Kubernetes NetworkPolicy cannot express that. It matches IP blocks — and the IPs behind a modern SaaS domain rotate constantly, sit behind CDNs, and differ per region. Teams end up allowlisting entire cloud provider IP ranges, which is security theater.
ACNS FQDN filtering lets the policy say what the human meant:
egress:
  - toFQDNs:
      - matchPattern: "*.bing.com"
The demo proves it with a client pod and a CiliumNetworkPolicy allowing only *.bing.com. The manifests explicitly target the shared traffic-demo namespace, so apply them there:
kubectl apply -f kubernetes-manifests/02-fqdn-demo-client.yaml
kubectl apply -f kubernetes-manifests/03-fqdn-filtering-policy.yaml
Then test the allowed and blocked destinations:
# Allowed — matches the FQDN pattern
kubectl exec -n traffic-demo deploy/demo-client -- ./agnhost connect www.bing.com:80 --timeout=5s

# Blocked — any other domain
kubectl exec -n traffic-demo deploy/demo-client -- ./agnhost connect www.example.com:80 --timeout=5s
The traffic-demo namespace is created by the baseline traffic manifest in Experiment 1. It is not a built-in AKS or Hubble namespace; the README standardizes every demo on it to avoid namespace confusion. Confirm it exists before running this experiment:
kubectl get namespace traffic-demoIf it was removed during cleanup, rerun the baseline traffic setup from Experiment 1. To observe dropped flows across every namespace, omit the namespace filter:
hubble observe --verdict DROPPEDThe mechanics are elegant. For pods under an FQDN policy, the Cilium agent marks DNS packets and redirects them to the ACNS security agent (a DaemonSet on every node). That agent decides whether each lookup is allowed, forwards permitted queries to the DNS server, watches the answers, and feeds the resulting FQDN→IP mappings back to the Cilium agent, which programs the kernel datapath on the fly. The pod can only reach addresses it legitimately resolved through an allowed name — everything else is dropped in-kernel. A nice resilience detail: because the security agent handles resolution, DNS keeps working for your pods even if the Cilium agent restarts. And you can literally watch the drops happen:
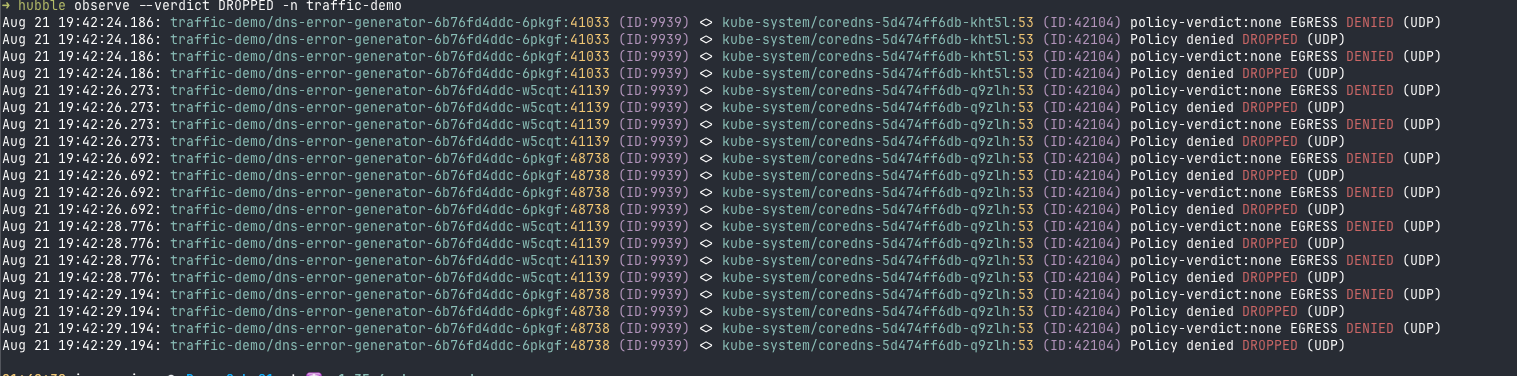
No IP lists to maintain. When the domain’s IPs change, the policy follows automatically. This is the feature I would enable first in any environment with egress compliance requirements.
Experiment 3: A firewall that reads HTTP
The final experiment goes one layer up. Network policies traditionally stop at “pod A may reach pod B on port 80.” But port 80 carries requests, and not all requests are equal: GET /products is browsing, POST /products is mutation, GET /admin should probably not happen from that client at all.
With ACNS in L7 mode, a CiliumNetworkPolicy can make exactly those distinctions. The demo deploys an nginx http-server and a curl http-client in the shared traffic-demo namespace, then applies an ingress policy allowing only GET /, GET /products, and GET /status/[0-9]+:
kubectl apply -f kubernetes-manifests/04-l7-demo-apps.yaml
kubectl apply -f kubernetes-manifests/05-l7-policy.yaml
kubectl apply -f kubernetes-manifests/12-l7-client-egress-policy.yaml
The moment of truth — same pods, same service, same port, different verbs and paths:
# ✅ 200 — GET /products is on the allowlist
kubectl exec -n traffic-demo deploy/http-client -- \
  curl -s -o /dev/null -w '%{http_code}\n' http://http-server/products

# ❌ 403 — same path, but POST is not allowed
kubectl exec -n traffic-demo deploy/http-client -- \
  curl -s -o /dev/null -w '%{http_code}\n' -X POST http://http-server/products

# ❌ 403 — GET /admin is not on the allowlist
kubectl exec -n traffic-demo deploy/http-client -- \
  curl -s -o /dev/null -w '%{http_code}\n' http://http-server/admin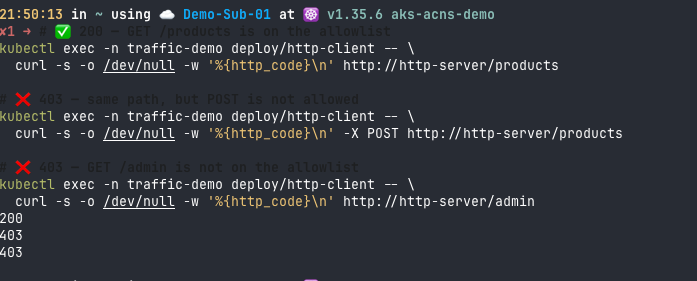
The 403 responses are generated by the node-local Envoy proxy the moment the L7 policy matched — the request never reaches nginx. This is also a quiet upgrade over L3/L4 policies, which drop unauthorized traffic silently: an L7 deny returns a proper application-level error code the client can handle gracefully. Defense-in-depth you normally buy with a service mesh — without installing one.
The free bonus: HTTP metrics you didn’t instrument
Once L7 policies give the data plane application-level visibility, the Hubble agent (part of the observability feature — the metrics don’t flow through Envoy itself) emits hubble_http_* metrics: request rates, status codes, and latency histograms per workload, for applications that were never instrumented. The demo includes a load generator that hammers the server with a realistic mix of 2xx/3xx/4xx/5xx responses, and then queries like these light up in Grafana Explore:
# Error rate (4xx + 5xx) by direction
sum by (reporter) (rate(hubble_http_requests_total{status=~"4..|5.."}[2m]))

# p95 latency, as observed by the network itself
histogram_quantile(0.95,
  sum by (le,reporter) (rate(hubble_http_request_duration_seconds_bucket[2m])))
Golden signals for a legacy app you cannot touch, measured at the kernel/proxy level. That alone can justify ACNS for teams stuck with uninstrumentable workloads.
The HTTP traffic also gets its own prebuilt dashboards in the same Azure Managed Prometheus Grafana folder:
- Kubernetes / Networking / L7 (Namespace) — HTTP, gRPC, and Kafka flows at namespace level
- Kubernetes / Networking / L7 (Workload) — per-workload L7 breakdown with methods, status codes, and latency
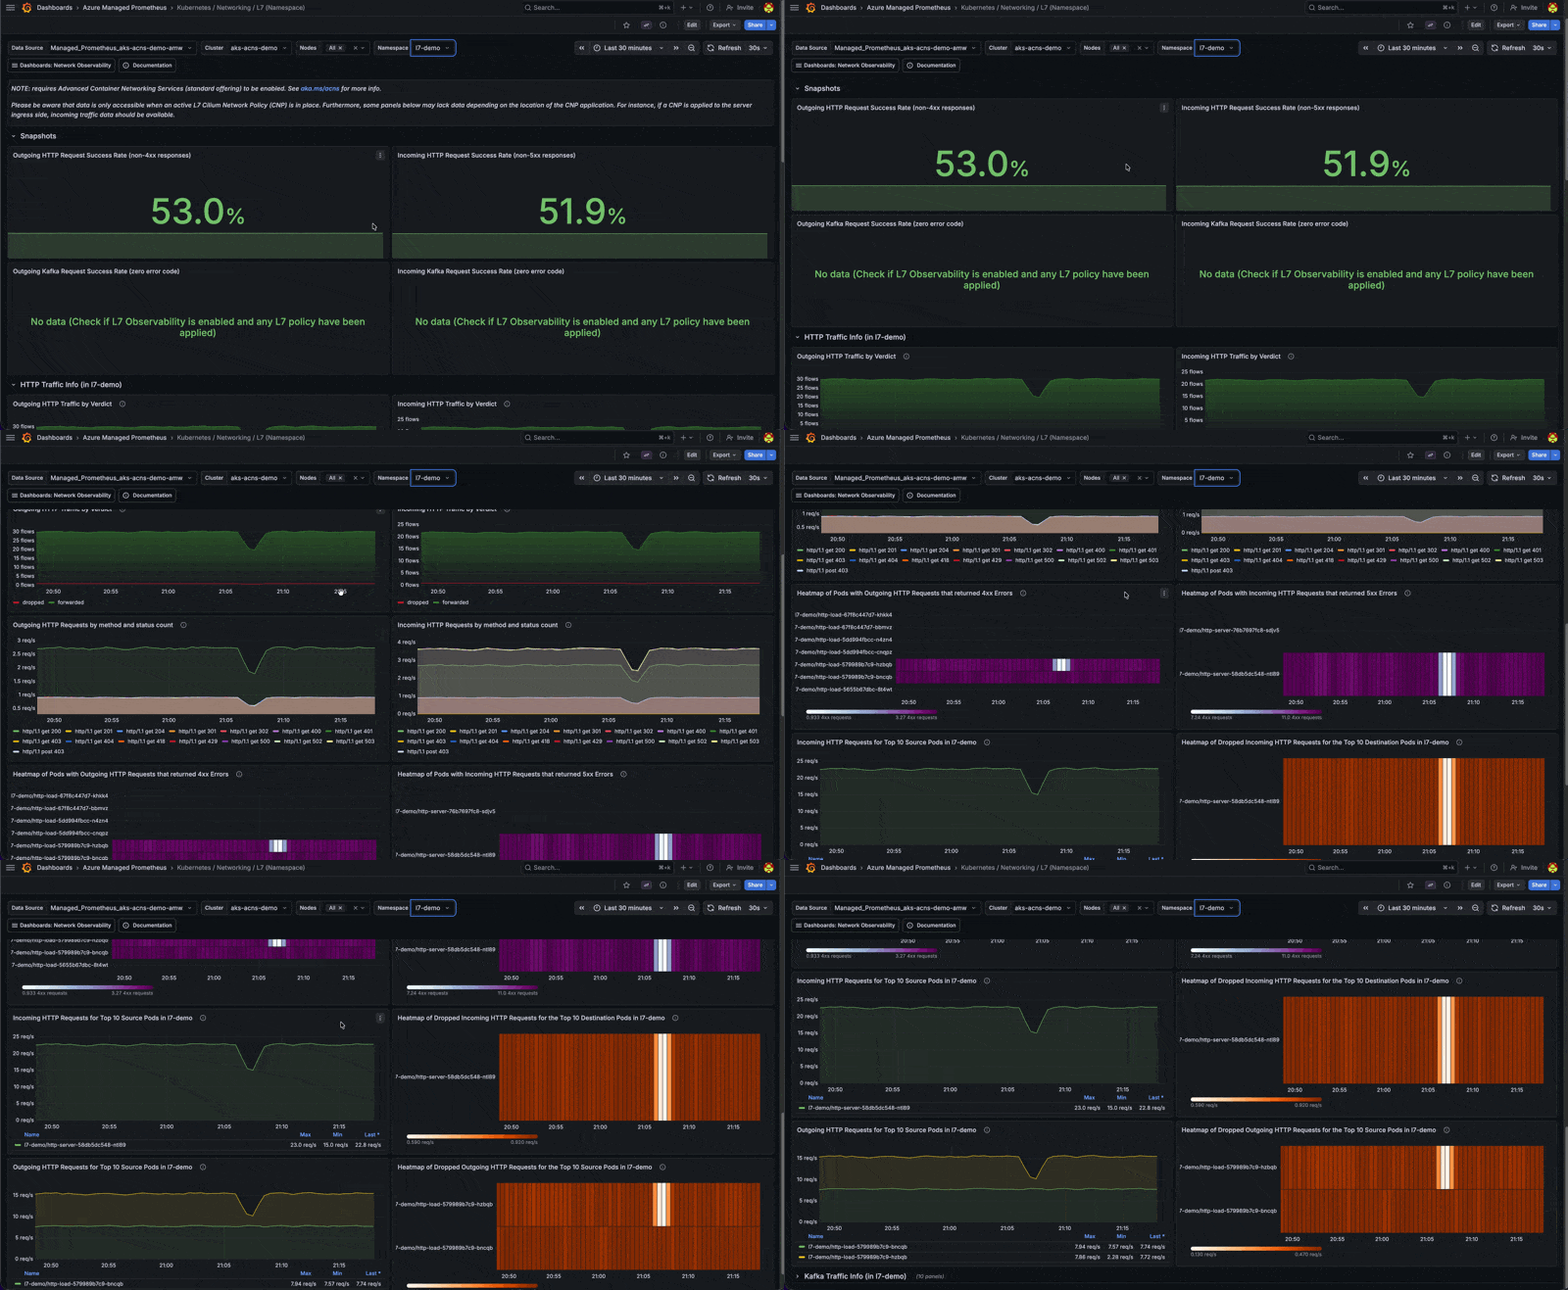
To populate those dashboards continuously, apply the load generator from the demo repository:
kubectl apply -f kubernetes-manifests/11-l7-load-generator.yaml
kubectl -n traffic-demo rollout restart deploy/http-client deploy/http-load
kubectl -n traffic-demo get pods -l role=load
Each loop hits the server’s generated 2xx/3xx/4xx/5xx endpoints, the allowed GET /products and GET / paths, and the denied POST /products and GET /admin paths. The first rollout restart is important: it lets Cilium regenerate the client endpoints with the Envoy proxy attached, so reporter="client" metrics start flowing.
Two field notes from getting this working, so you don’t rediscover them:
- Client-side metrics need a client-side policy. Envoy only attaches where an L7 policy exists. Without the egress policy on
http-client(12-l7-client-egress-policy.yaml), Hubble reports onlyreporter="server"metrics and the Outgoing HTTP Grafana panels stay empty. - Restart the client pods once after applying the L7 policies, as shown above, so Cilium regenerates the endpoints with the proxy attached.
When should you turn this on?
My honest take after building the demo:
- Observability: almost always. It works with any Azure CNI variant, needs no Cilium migration, and the first prevented multi-hour DNS goose chase pays for the setup. Just remember the Prometheus keep-list.
- FQDN filtering: whenever egress control matters. It replaces the worst kind of security config — stale IP allowlists — with policies that read like the requirement.
- L7 policies: selectively. They shine on high-value internal APIs where method/path control adds real defense, and on legacy workloads where the free HTTP metrics are the actual prize. There is an Envoy hop in the path for matched traffic — Microsoft documents noticeable latency degradation beyond ~3,000 requests/second — so apply them where they earn it rather than cluster-wide. Also note L7 policies aren’t supported in
CiliumClusterwideNetworkPolicyand aren’t compatible with L7 policies from the Istio managed add-on. - Mind the limits. FQDN-filtered pods can degrade beyond ~1,000 requests/second, FQDN policies can’t target Kubernetes service names, and Alpine-based images may hit DNS resolution quirks (musl’s search-domain handling) that need extra
matchPatternentries. Security features require Azure CNI Powered by Cilium and Kubernetes 1.29+. - Mind the cost. ACNS itself is a paid offering, and the Hubble metrics land in Azure Monitor with its own ingestion pricing — keep an eye on cardinality.
The black box does not have to stay a black box. Enable the camera, hire the bouncer, and the next time someone says “it’s probably DNS,” you will already have the chart open.
Spin up the demo environment, run the three experiments, and tear it down with ./cleanup.sh when you are done.