
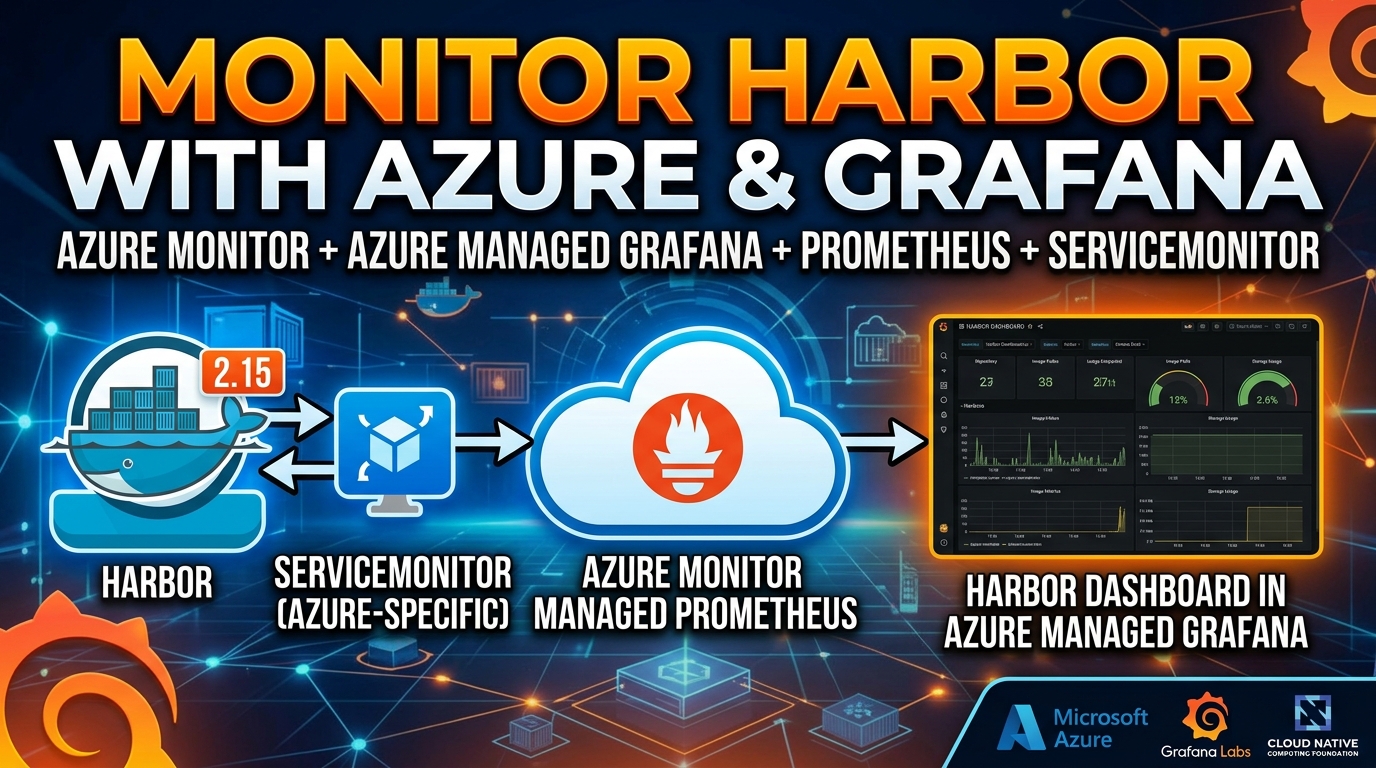

Harbor already exposes the Prometheus metrics you need to answer practical operational questions: Are all components healthy? Are registry requests slowing down? Is a project close to its quota? Are background jobs backing up?
If Harbor runs on Kubernetes, Azure Monitor managed service for Prometheus can collect those metrics without another Prometheus server. Azure Managed Grafana can then query the Azure Monitor workspace and turn the data into dashboards and alerts.
There is one Azure-specific detail that is easy to miss:
Azure Monitor uses
azmonitoring.coreos.com/v1for itsServiceMonitorandPodMonitorresources. It does not scrape resources created with the Prometheus Operator’smonitoring.coreos.com/v1API group.
That matters because the official Harbor Helm chart can create a ServiceMonitor, but it uses the OSS API group. In this post, I will enable Harbor’s metrics, leave that monitor disabled, and create an Azure-compatible ServiceMonitor instead.
What We Are Building
The metrics path looks like this:
flowchart TB
    subgraph Harbor["Harbor on Kubernetes"]
        Exporter["exporter Service"]
        Core["core Service"]
        Registry["registry Service"]
        Jobservice["jobservice Service"]
    end

    ServiceMonitor["Azure ServiceMonitor<br/>azmonitoring.coreos.com/v1"]
    Collector["ama-metrics collector"]
    Workspace["Azure Monitor workspace"]
    Grafana["Azure Managed Grafana"]

    Exporter --> ServiceMonitor
    Core --> ServiceMonitor
    Registry --> ServiceMonitor
    Jobservice --> ServiceMonitor
    ServiceMonitor --> Collector --> Workspace --> Grafana
The walkthrough assumes you already have:
- Harbor 2.15 running on Kubernetes
kubectland, for a Helm deployment,helmaccess to the cluster- Azure Monitor managed service for Prometheus enabled on the cluster
- An Azure Monitor workspace receiving metrics from the cluster
- An Azure Managed Grafana workspace
- Permission to manage Grafana data sources and Azure role assignments
The cluster can be AKS or another supported Kubernetes cluster connected to Azure Monitor. Azure resource provisioning is outside the scope of this post.
The Metrics Harbor Exposes
Harbor exposes Prometheus metrics from four components:
| Component | What it tells you | Example metrics |
|---|---|---|
| Exporter | Overall health, projects, repositories, artifacts, quotas, and task queues | harbor_health, harbor_up, harbor_project_repo_total, harbor_project_quota_usage_byte |
| Core | API request volume, in-flight requests, and request duration | harbor_core_http_request_total, harbor_core_http_request_duration_seconds |
| Registry | Registry HTTP traffic, latency, response sizes, storage actions, and cache activity | registry_http_requests_total, registry_http_request_duration_seconds_bucket, registry_storage_action_seconds_bucket |
| Jobservice | Background job throughput and processing time | harbor_jobservice_task_total, harbor_jobservice_task_process_time_seconds |
The Harbor 2.15 metrics reference lists the complete set, labels, and metric types.
Harbor’s documentation describes component queries such as /metrics?comp=core. The Helm chart takes a Kubernetes-friendly approach: when metrics are enabled, the exporter, core, registry, and jobservice Services each expose a named metrics port. The ServiceMonitor can discover all four Services and scrape /metrics directly.
Enable Harbor Metrics
For the official Helm chart, add these values to the values file used for your Harbor release:
metrics:
  enabled: true
  serviceMonitor:
    enabled: false
metrics.enabled adds the metric endpoints and Service ports. Keep metrics.serviceMonitor.enabled set to false: the chart-generated resource uses monitoring.coreos.com/v1, which Azure Monitor does not watch.
Apply the values through your normal Harbor upgrade process and pin the same chart version you already operate. For example:
helm get values harbor -n harbor > harbor-current-values.yaml

# Add the metrics block to harbor-current-values.yaml, then use your pinned version.
helm upgrade harbor harbor/harbor \
  --namespace harbor \
  --version <YOUR_HARBOR_CHART_VERSION> \
  -f harbor-current-values.yaml
Do not copy the example command without checking your release name, namespace, chart repository, and current values first.
For a non-Helm deployment, enable the equivalent metric settings in your Harbor configuration. The endpoint still needs to be reachable from the Azure Monitor collector inside the cluster.
Inspect the generated Services
Do not guess the labels or port names. Inspect what your release created:
kubectl get services -n harbor --show-labels

kubectl get services -n harbor \
  -l release=harbor,app=harbor \
  -o custom-columns='NAME:.metadata.name,PORT_NAMES:.spec.ports[*].name,PORTS:.spec.ports[*].port'
With the default release name and HTTP between Harbor components, the four metric Services share these labels:
release=harbor
app=harbor
They also expose a port named http-metrics. If Harbor internal TLS is enabled, the Helm chart names it https-metrics instead. Change the ServiceMonitor endpoint and TLS settings to match your deployment.
Test a source endpoint
Choose the exporter Service name from the previous output and port-forward its metrics port:
kubectl port-forward -n harbor service/<HARBOR_EXPORTER_SERVICE> 8001:8001In another terminal:
curl -fsS http://127.0.0.1:8001/metrics | grep -E '^harbor_(health|up)'Fix an empty, refused, or TLS-failing endpoint here. A ServiceMonitor cannot make an unreachable endpoint scrapeable.
Create the Azure ServiceMonitor
Enabling managed Prometheus installs Azure’s PodMonitor and ServiceMonitor CRDs. Confirm they are present:
kubectl api-resources --api-group=azmonitoring.coreos.comCreate harbor-azure-monitor.yaml:
apiVersion: azmonitoring.coreos.com/v1
kind: ServiceMonitor
metadata:
  name: harbor-azure-monitor
  namespace: harbor
spec:
  labelLimit: 63
  labelNameLengthLimit: 511
  labelValueLengthLimit: 1023
  selector:
    matchLabels:
      release: harbor
      app: harbor
  endpoints:
    - port: http-metrics
      path: /metrics
      interval: 30s
      scrapeTimeout: 10s
      honorLabels: true
      relabelings:
        - sourceLabels: [__meta_kubernetes_service_name]
          targetLabel: harbor_service
Apply it:
kubectl apply -f harbor-azure-monitor.yaml
kubectl get servicemonitor.azmonitoring.coreos.com -n harbor
This single selector matches the Harbor component Services. Prometheus service discovery discards a selected Service when it does not contain the named http-metrics port, so Harbor’s non-metric Services do not become scrape targets.
Replace release: harbor, app: harbor, the namespace, and the port name with the values you inspected. Because the ServiceMonitor is in the same namespace as the Services, it does not need a namespaceSelector.
Microsoft recommends the three label-limit fields shown above. Without them, a custom monitor can be dropped during Azure’s processing.
If Harbor uses internal TLS
Harbor supports TLS for communication between its internal components. When it is enabled, the Helm chart exposes the named https-metrics port instead of http-metrics. Configure the ServiceMonitor to use that port and trust the CA that signed Harbor’s internal certificates.
See Configure Internal TLS Communication Between Harbor Components for Harbor’s certificate requirements and setup instructions.
Why not a ConfigMap or PodMonitor?
A ServiceMonitor CRD is enough for these Service-backed targets. The ama-metrics-settings-configmap is useful when you need global scrape settings, default-target changes, metric filtering, or secret-access configuration, but it is not required for this path.
A PodMonitor is a valid alternative when an application has no suitable Service. It must still use azmonitoring.coreos.com/v1. For Harbor Helm, the component Services make a ServiceMonitor the cleaner option.
Verify the Collector
First, confirm the monitor’s selector matches the Services you expect:
kubectl get services -n harbor \
  -l release=harbor,app=harbor \
  -o custom-columns='NAME:.metadata.name,METRICS_PORT:.spec.ports[?(@.name=="http-metrics")].port'

kubectl describe servicemonitor.azmonitoring.coreos.com \
  harbor-azure-monitor \
  -n harbor
Then check the Azure Monitor collector:
kubectl get pods -n kube-system | grep ama-metricsThe collector pods should be running. Review the target allocator when discovery fails:
kubectl logs -n kube-system <AMA_METRICS_OPERATOR_TARGETS_POD> \
  -c targetallocator \
  --tail=100
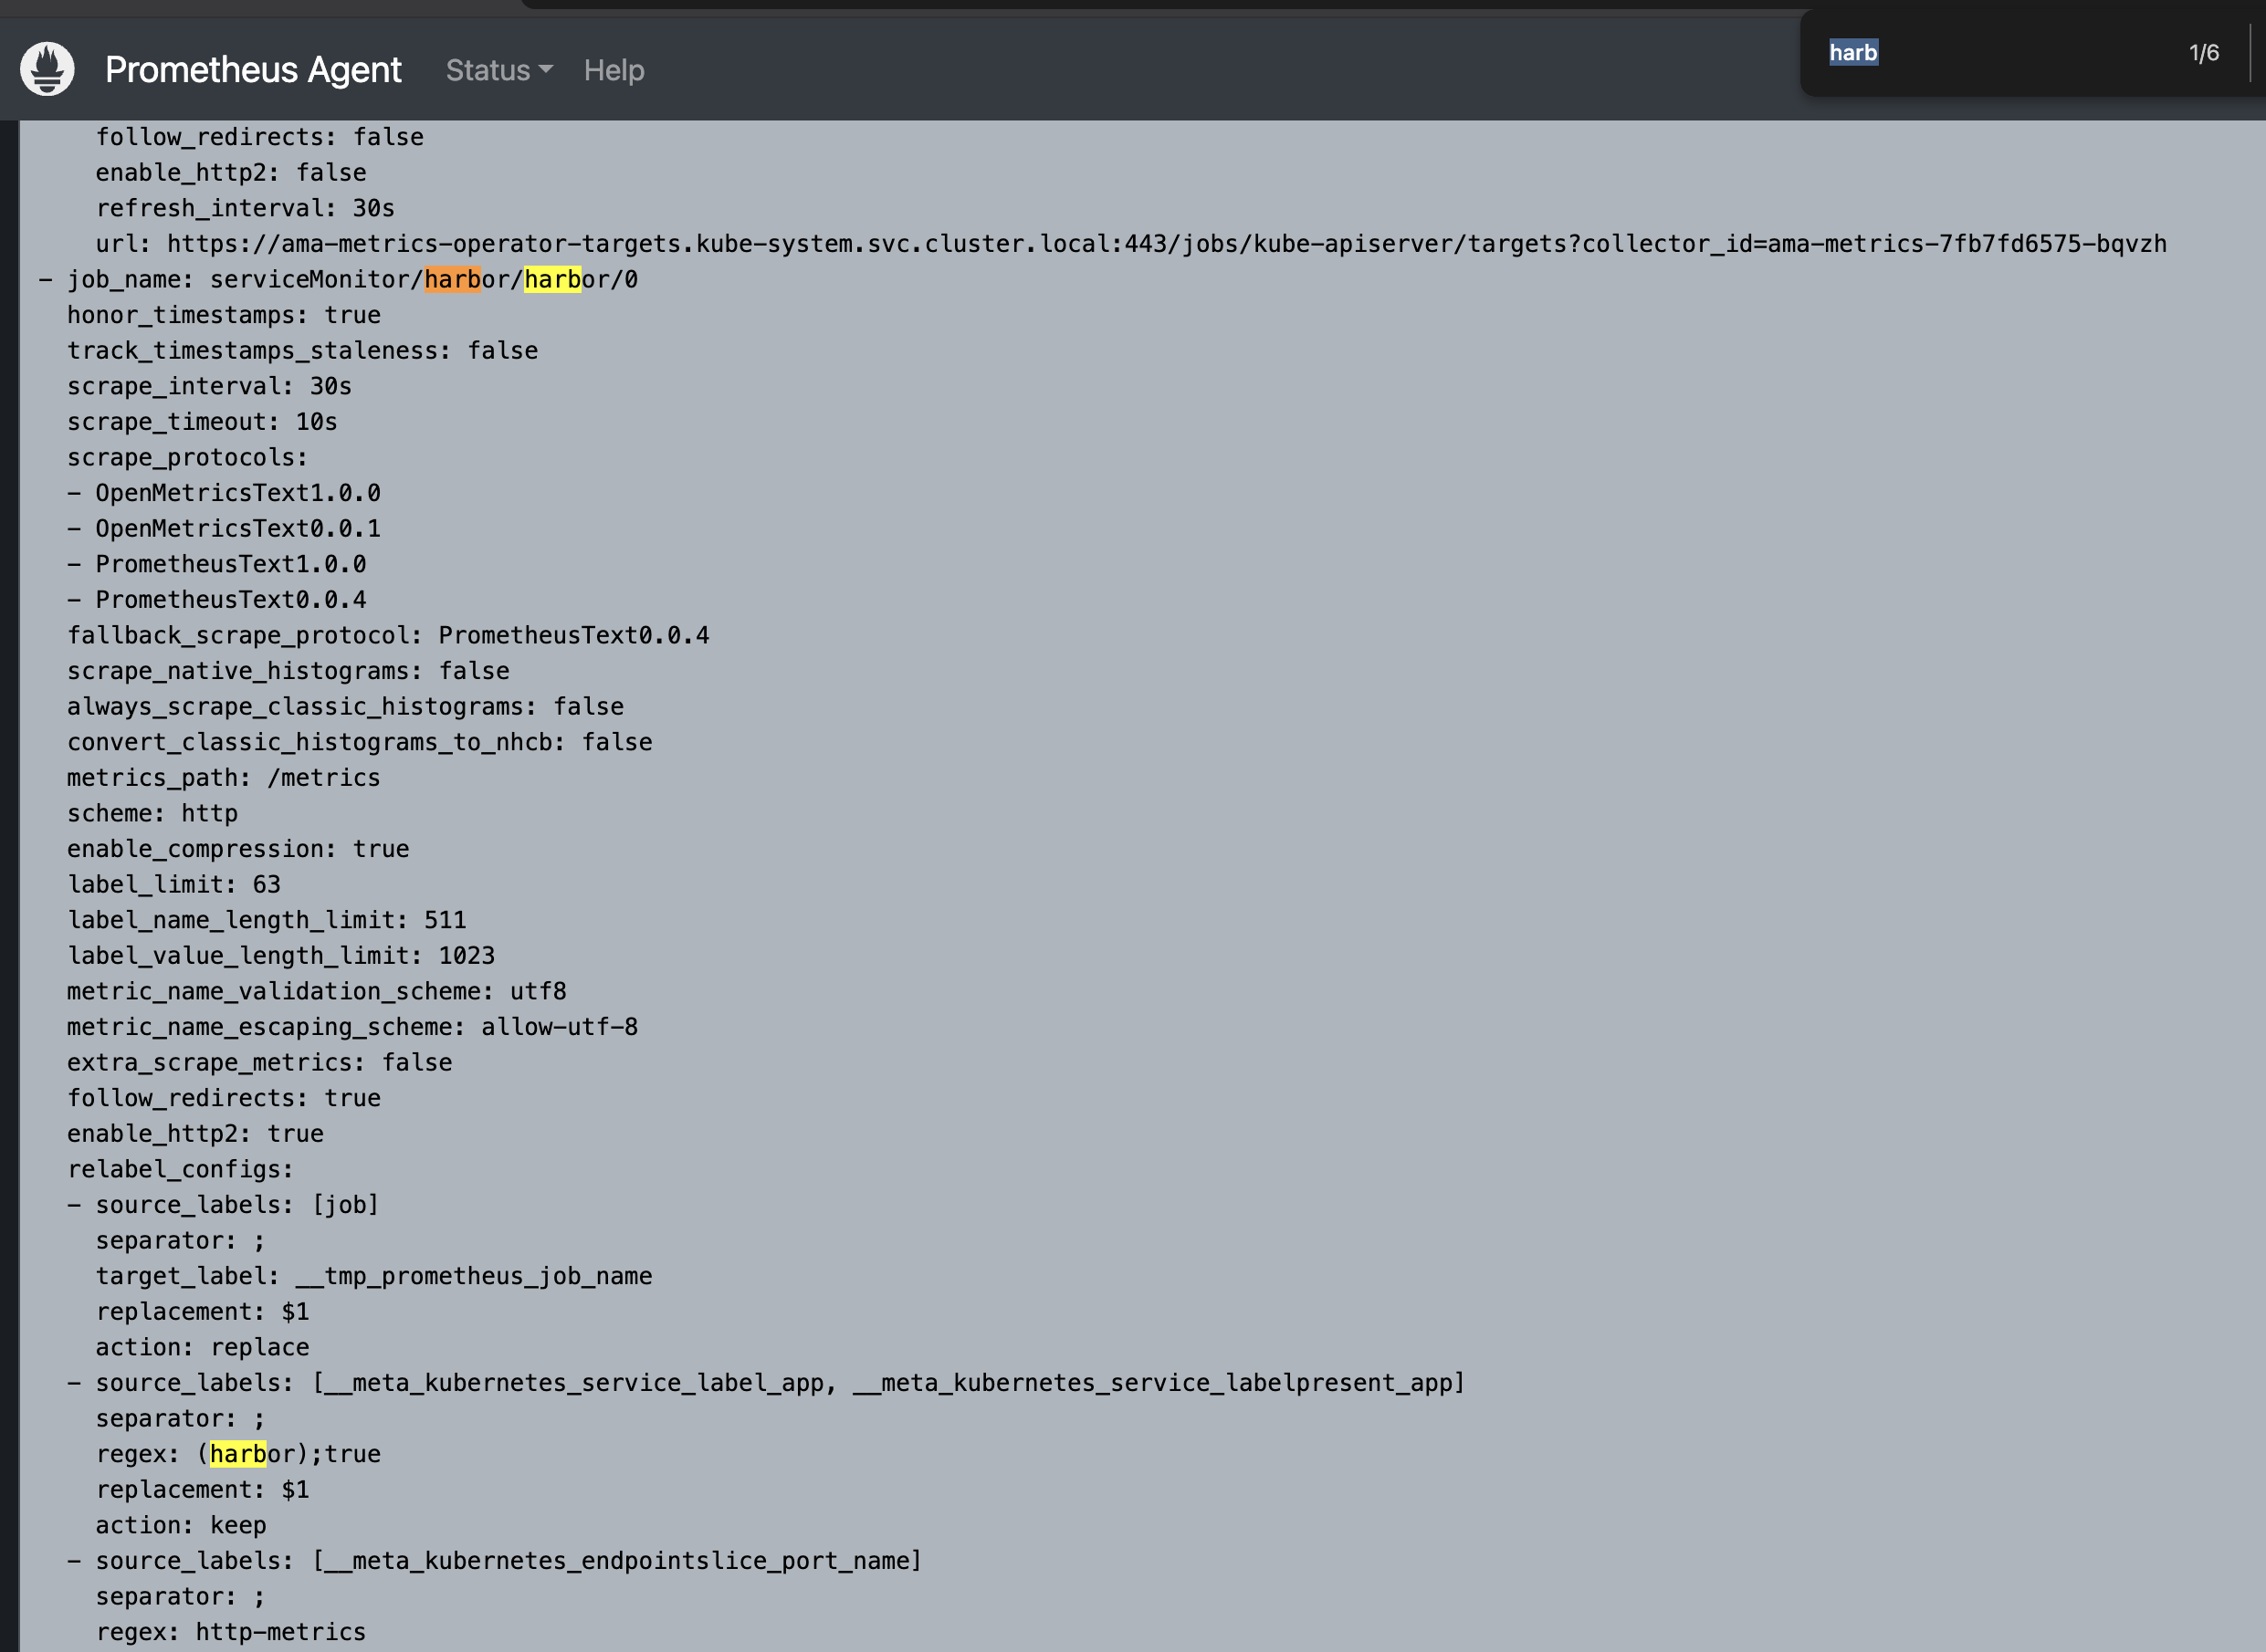
The Prometheus Agent UI is the fastest way to follow a target through discovery. Select an ama-metrics-... collector pod from the pod list, then run:
kubectl port-forward -n kube-system pod/<AMA_METRICS_COLLECTOR_POD> 9090:9090Open these pages:
- http://127.0.0.1:9090/config to confirm the ServiceMonitor became scrape configuration
- http://127.0.0.1:9090/service-discovery to see the selected Kubernetes targets
- http://127.0.0.1:9090/targets to see the last scrape and any endpoint error
Look for a pool named like serviceMonitor/harbor/harbor-azure-monitor. The Harbor endpoints should be UP.
Confirm the Metrics in Azure Monitor
Open the Azure Monitor workspace in the Azure portal, select Prometheus explorer, and start with:
harbor_upYou should see one series for each Harbor component reported by the exporter. Continue with:
harbor_healthsum by (method, operation) (
rate(harbor_core_http_request_total[5m])
)sum by (status, type) (
rate(harbor_jobservice_task_total[5m])
)If harbor_up exists but core, registry, or jobservice metrics do not, return to the collector targets page. That usually means only the exporter Service was discovered or the other named ports are not reachable.
Connect Azure Managed Grafana
Azure Managed Grafana uses its managed identity to query the Azure Monitor workspace.
- Open the Azure Monitor workspace and copy its Query endpoint.
- Open the Grafana workspace.
- Go to Connections → Data sources → Add data source.
- Select Azure Monitor Managed Service for Prometheus on Grafana 13 or later. Grafana 11 and 12 can use the Prometheus data source with Azure authentication.
- Paste the workspace query endpoint into Prometheus server URL.
- Select Azure Auth and Managed Identity.
- Select Save & test.
The Grafana managed identity needs Monitoring Data Reader for the Azure Monitor workspace. Azure Managed Grafana commonly receives this role at subscription scope when it is created. For least privilege, verify the existing assignment and scope it to the resource group or workspace that Grafana actually needs.
Use Explore and run harbor_up. Do not start building a dashboard until this query returns the same series you saw in Prometheus explorer.
Build the Harbor Dashboard
You can start with the community Harbor dashboard in the Grafana dashboard gallery or import this Azure Monitor Managed Prometheus Harbor dashboard. Neither is an Azure-specific guaranteed drop-in: select your Azure managed Prometheus data source and review every imported query and variable.
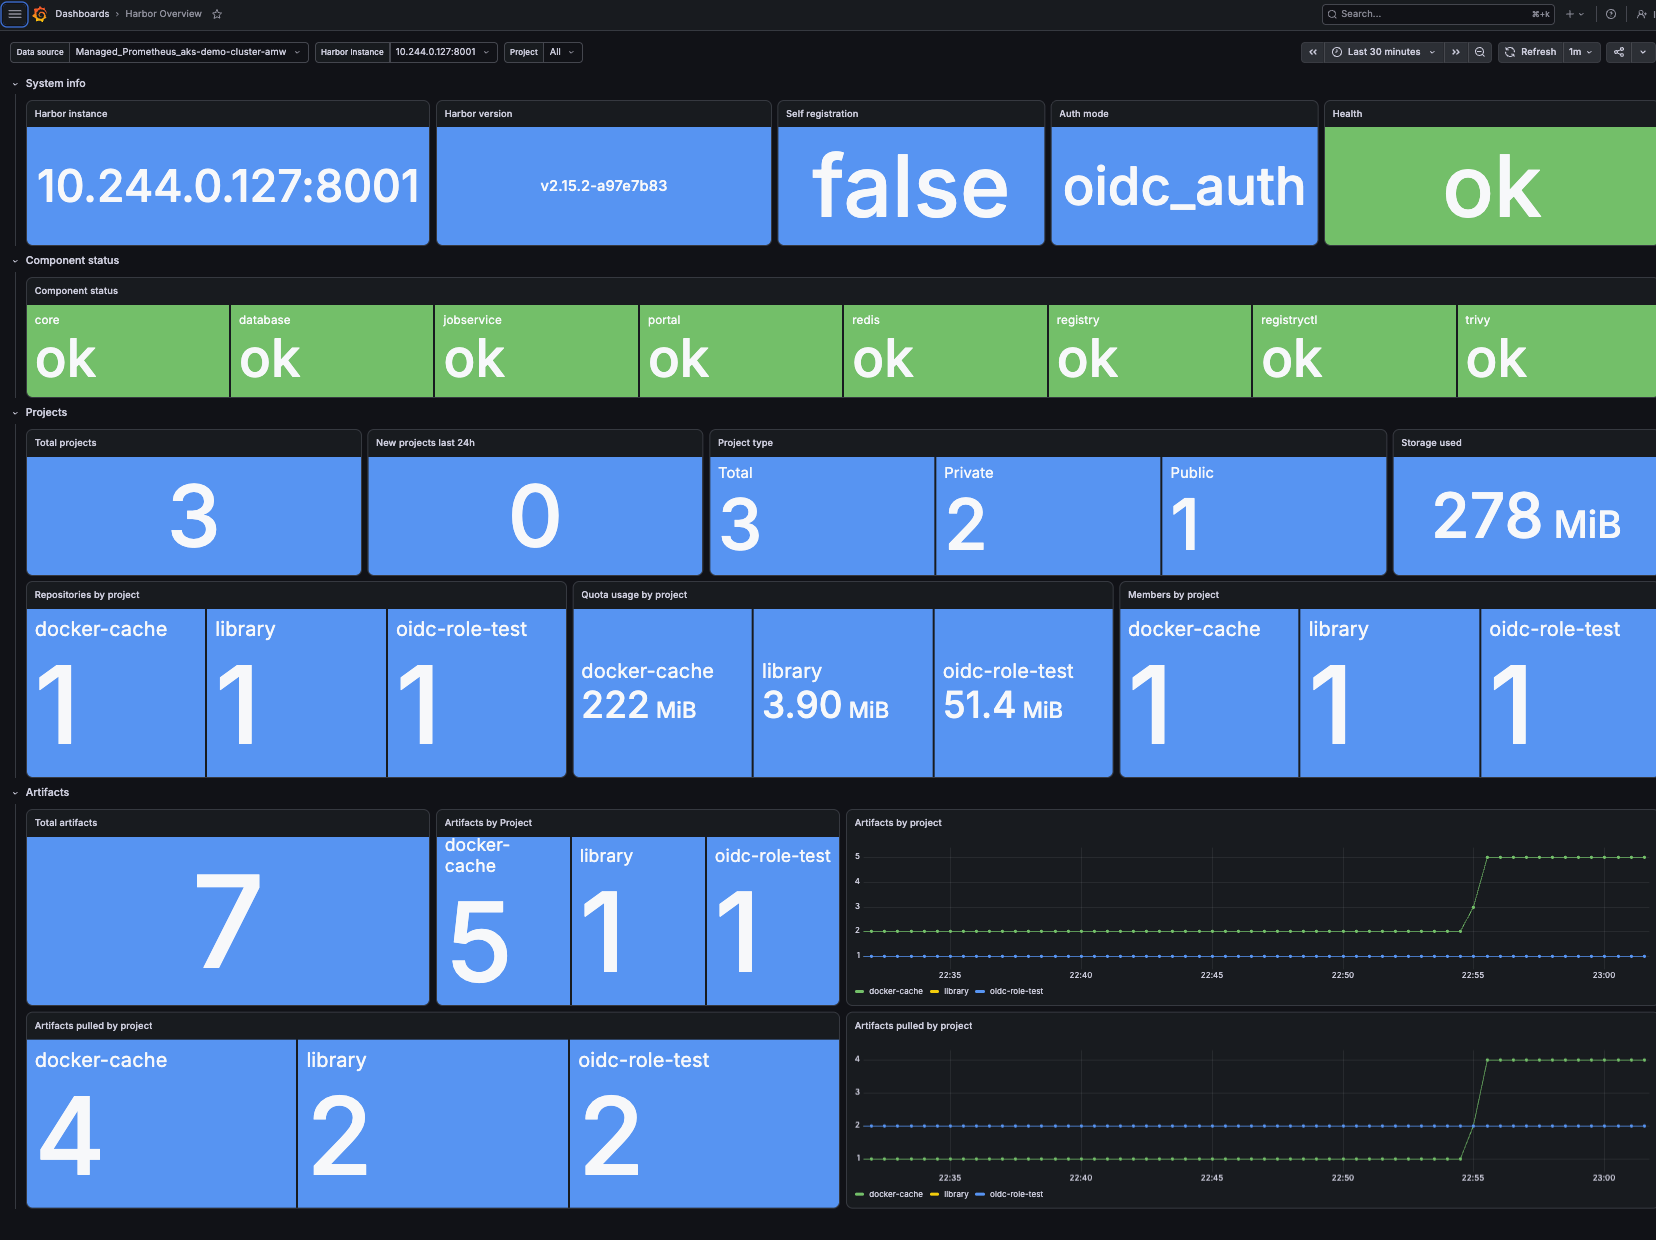
Start with a dashboard variable for the labels that exist in your data. cluster, namespace, and the harbor_service label added by the ServiceMonitor are useful candidates. Do not copy variables from another dashboard before confirming the label names in Explore.
These panels form a useful first dashboard.
Component availability
min by (component) (harbor_up)Use a state timeline or status history panel. A value of 0 means the component is unavailable.
Overall Harbor health
min(harbor_health)Use a stat panel with value mappings for healthy and unhealthy states.
Project quota utilization
100 *
harbor_project_quota_usage_byte
/
clamp_min(harbor_project_quota_byte, 1)Use a table or bar gauge grouped by project_name. Set the unit to percent.
Core request rate
sum by (method, operation) (
  rate(harbor_core_http_request_total[5m])
)Use a time series panel. Filter low-value operations or move them into a table if the legend becomes too busy.
Core p99 request duration
Harbor exposes core duration as a Prometheus summary, so select its exported quantile directly:
max by (operation) (
harbor_core_http_request_duration_seconds{quantile="0.99"}
)This Harbor deployment exposes 0.5, 0.9, and 0.99 summary quantiles. Confirm the available quantile label values in your own metrics before choosing a percentile. Do not apply histogram_quantile to summary quantiles.
Registry 5xx percentage
100 *
sum(rate(registry_http_requests_total{code=~"5.."}[5m]))
/
clamp_min(sum(rate(registry_http_requests_total[5m])), 1)Use a stat and time series panel. A low-traffic registry can produce short spikes, so alert only after a sustained window.
Registry p95 request duration
Registry duration is a histogram, so calculate its quantile from buckets:
histogram_quantile(
0.95,
sum by (le, handler) (
rate(registry_http_request_duration_seconds_bucket[5m])
)
)Job queue depth
max by (type) (harbor_task_queue_size)Pair queue depth with queue latency and job processing status to distinguish a brief burst from a stuck worker pool.
Job results
sum by (status, type) (
  rate(harbor_jobservice_task_total[5m])
)Inspect the status values your Harbor release exports before creating a failure-only filter.
Suggested alerts
| Signal | Starting condition | Why it matters |
|---|---|---|
| Component down | harbor_up == 0 for 5 minutes | A Harbor dependency or service is unavailable |
| Harbor unhealthy | harbor_health == 0 for 5 minutes | Overall health checks are failing |
| Registry errors | 5xx percentage above your baseline for 10 minutes | Pushes and pulls might be failing |
| High registry latency | p95 above the user-facing SLO for 10 minutes | Registry operations are degraded |
| Queue backlog | Queue size and latency both grow for 15 minutes | Jobservice might not be keeping up |
| Project quota | Quota utilization above 85 percent | A project is approaching its storage limit |
Treat those durations and thresholds as starting points. Tune them against normal traffic, maintenance windows, and your own SLOs.
Control Cardinality and Cost
Harbor metrics include labels such as project_name, operation, handler, status, and type. They are useful, but every unique label combination creates another time series in the Azure Monitor workspace.
Start by collecting the full Harbor metric set. Measure ingestion and confirm the dashboard and alert queries. Only then add metricRelabelings to keep a smaller set.
For example:
metricRelabelings:
  - sourceLabels: [__name__]
    action: keep
    regex: '(harbor_health|harbor_up|harbor_project_quota_.*|harbor_core_http_.*|harbor_task_.*|harbor_jobservice_.*|registry_http_.*|registry_storage_.*)'
Keep the regular expression on one logical YAML value, and retest every dashboard panel after changing it. A restrictive allowlist can silently remove a metric that an alert needs.
Secure the Metrics Path
Harbor metric endpoints should remain cluster-internal unless there is a deliberate reason to expose them. Use ClusterIP Services, Kubernetes network policy, and private cluster networking to limit reachability.
The metrics include project names, Harbor configuration labels, traffic patterns, and health state. They do not belong on a public ingress.
When TLS or basic authentication protects the endpoint:
- Keep credentials in Kubernetes Secrets.
- Give the collector only the secret access it requires.
- Trust the issuing CA instead of disabling certificate verification.
- Follow Azure Monitor’s namespace-scoped secret access guidance for your Kubernetes version.
Troubleshooting
| Symptom | Likely cause | Check |
|---|---|---|
| ServiceMonitor exists but no scrape job appears | OSS API group was used | Confirm apiVersion: azmonitoring.coreos.com/v1 |
| Scrape job has no targets | Service labels do not match | Compare spec.selector with kubectl get svc --show-labels |
| Selected Service is missing | Monitor and Service are in different namespaces | Co-locate them or add the correct namespaceSelector |
| Target is discovered but dropped | Named metrics port does not match | Inspect .spec.ports[*].name and use http-metrics or https-metrics |
| Custom monitor is rejected or ignored | Azure label limits are missing | Add the three Microsoft-recommended limit fields |
| Target reports connection refused | Harbor metrics are not enabled or the Service port is wrong | Port-forward the Service and test /metrics |
| Target reports an x509 error | Internal TLS CA is not trusted | Configure scheme: https and tlsConfig.ca |
| Metrics exist in Azure but not Grafana | Wrong data source, query endpoint, or RBAC | Test harbor_up in Explore and verify Monitoring Data Reader |
| Ingestion becomes expensive | High-cardinality labels or unnecessary metrics | Review workspace ingestion and add a tested metric allowlist |
For collector-level failures, use Microsoft’s Prometheus collection troubleshooting guide. It covers collector logs, service discovery, targets, authentication, and ingestion limits.
Cleanup
Remove only the monitor created for this walkthrough:
kubectl delete servicemonitor.azmonitoring.coreos.com \
  harbor-azure-monitor \
  -n harbor
Delete the imported Grafana dashboard if it was only for testing. Do not disable Harbor metrics, remove the Azure Monitor add-on, or delete shared Azure resources unless that is part of your own change plan.
Closing Thoughts
The difficult part is not exposing Harbor’s Prometheus metrics. It is making sure the right collector discovers them.
With Azure Monitor managed Prometheus, that boundary is explicit: use azmonitoring.coreos.com/v1, match the real Harbor Service labels and named ports, and verify each hop before moving on. Once harbor_up reaches the Azure Monitor workspace, Azure Managed Grafana gives you the familiar PromQL and dashboard workflow without operating another Prometheus stack.
Further Reading
- Harbor 2.15 metrics
- Harbor Helm configuration values
- Create custom Prometheus scrape jobs with Azure Monitor CRDs
- Customize Prometheus scraping in Azure Monitor
- Troubleshoot Prometheus metric collection
- Connect Grafana to Azure Monitor managed service for Prometheus
- Modify Azure Managed Grafana permissions