



When a workload is slow, the application is only part of the picture. The Kubernetes control plane may also be under pressure: API requests could be slow or throttled, etcd could be approaching a storage limit, or the scheduler could be struggling to place pods.
On AKS, Microsoft manages the control plane, so you can’t log in to its API server, etcd, scheduler, or controller-manager pods. That doesn’t mean you have to operate without visibility. AKS can send control plane Prometheus metrics to an Azure Monitor workspace, where you can query them and visualize them with Azure Managed Grafana.
I put together a Terraform demo for AKS control plane metrics that enables collection, applies a custom scrape configuration, imports the API server and etcd dashboards, and generates some API traffic so the panels have data to show.
Two kinds of AKS control plane metrics
It’s useful to distinguish the Azure Monitor platform metrics from the Prometheus metrics:
| Metric path | What it provides | Where to view it |
|---|---|---|
| Azure Monitor platform metrics | A supported subset of AKS metrics, including API server and etcd CPU and memory usage. These are collected automatically and are available at no cost. | Azure Monitor Metrics Explorer and metric alerts |
| Control plane metrics with managed Prometheus | Prometheus metrics from control plane targets such as the API server and etcd, plus optional targets such as the scheduler and controller-manager. | The cluster’s Azure Monitor workspace and connected Azure Managed Grafana |
The platform metrics are useful for a quick view of resource utilization. Prometheus metrics give you more detailed signals, such as request rates, latency histograms, in-flight requests, etcd health, and scheduler activity. The two paths complement each other; enabling one doesn’t mean every metric from the other path is available.
How the demo is wired
The demo provisions an AKS cluster with managed identity and the Azure Monitor managed Prometheus add-on, an Azure Monitor workspace, the collection rule resources and associations, and Azure Managed Grafana. It then enables control plane metrics on the cluster.
The flow looks like this:
- A collector for control plane metrics scrapes the selected targets in the AKS-managed control plane.
- The collector sends the metrics through the configured data collection endpoint and rule to the Azure Monitor workspace.
- Azure Managed Grafana queries the workspace and renders the dashboards.
This collector is separate from the ama-metrics pods used for node and cluster metrics. It isn’t a pod you can inspect with kubectl. The ama-metrics-settings-configmap in kube-system configures both the ordinary managed Prometheus collection and the control plane targets.
Enable control plane metrics
The cluster needs managed identity authentication and the managed service for Prometheus add-on. For a new cluster, the relevant Azure CLI options are:
az aks create \
  --resource-group <resource-group> \
  --name <cluster-name> \
  --enable-control-plane-metrics \
  --enable-azure-monitor-metrics
For an existing cluster where the managed Prometheus add-on is already enabled:
az aks update \
  --resource-group <resource-group> \
  --name <cluster-name> \
  --enable-control-plane-metrics
The demo uses Terraform to provision its resources and an AzAPI update to set the control plane metrics property on the AKS resource. It also includes an option to enable the feature with Azure CLI instead, which can be useful when demonstrating the change separately from the initial deployment.
After enabling collection, allow several minutes for metrics to appear in the workspace. The demo README notes that its dashboards can take around 5–10 minutes to populate.
Choose which targets and metrics to collect
API server and etcd are the default control plane scrape targets. Other targets, including the scheduler, controller-manager, cluster autoscaler, and node auto-provisioning, are off by default. You can enable and tune control plane collection in the controlplane-metrics section of the ama-metrics-settings-configmap.
For example, the demo enables the scheduler and controller-manager in addition to the default targets:
controlplane-metrics: |-
  default-targets-scrape-enabled: |-
    apiserver = true
    etcd = true
    kube-scheduler = true
    kube-controller-manager = true
    cluster-autoscaler = false
    node-auto-provisioning = false
  default-targets-metrics-keep-list: |-
    apiserver = "apiserver_request_duration_seconds_bucket|apiserver_request_duration_seconds_sum|apiserver_request_duration_seconds_count|apiserver_longrunning_requests"
    etcd = "etcd_network_client_grpc_received_bytes_total|etcd_debugging_mvcc_keys_total"
  minimal-ingestion-profile: |-
    enabled = true
This is the relevant section of the ConfigMap, not a complete standalone manifest; use the full file in the demo repository. The minimal ingestion profile limits how many metrics are stored. The keep-list adds selected metrics to the profile. For the p99 query below, only the _bucket series are required; retain _sum and _count if you also need averages or totals.
The configuration format is schema v2. In particular, the control plane settings live under controlplane-metrics, and the target setting is named default-targets-scrape-enabled. If you are adapting an older ConfigMap, follow the current Microsoft configuration guidance rather than carrying forward the older schema unchanged.
Explore the API server and etcd
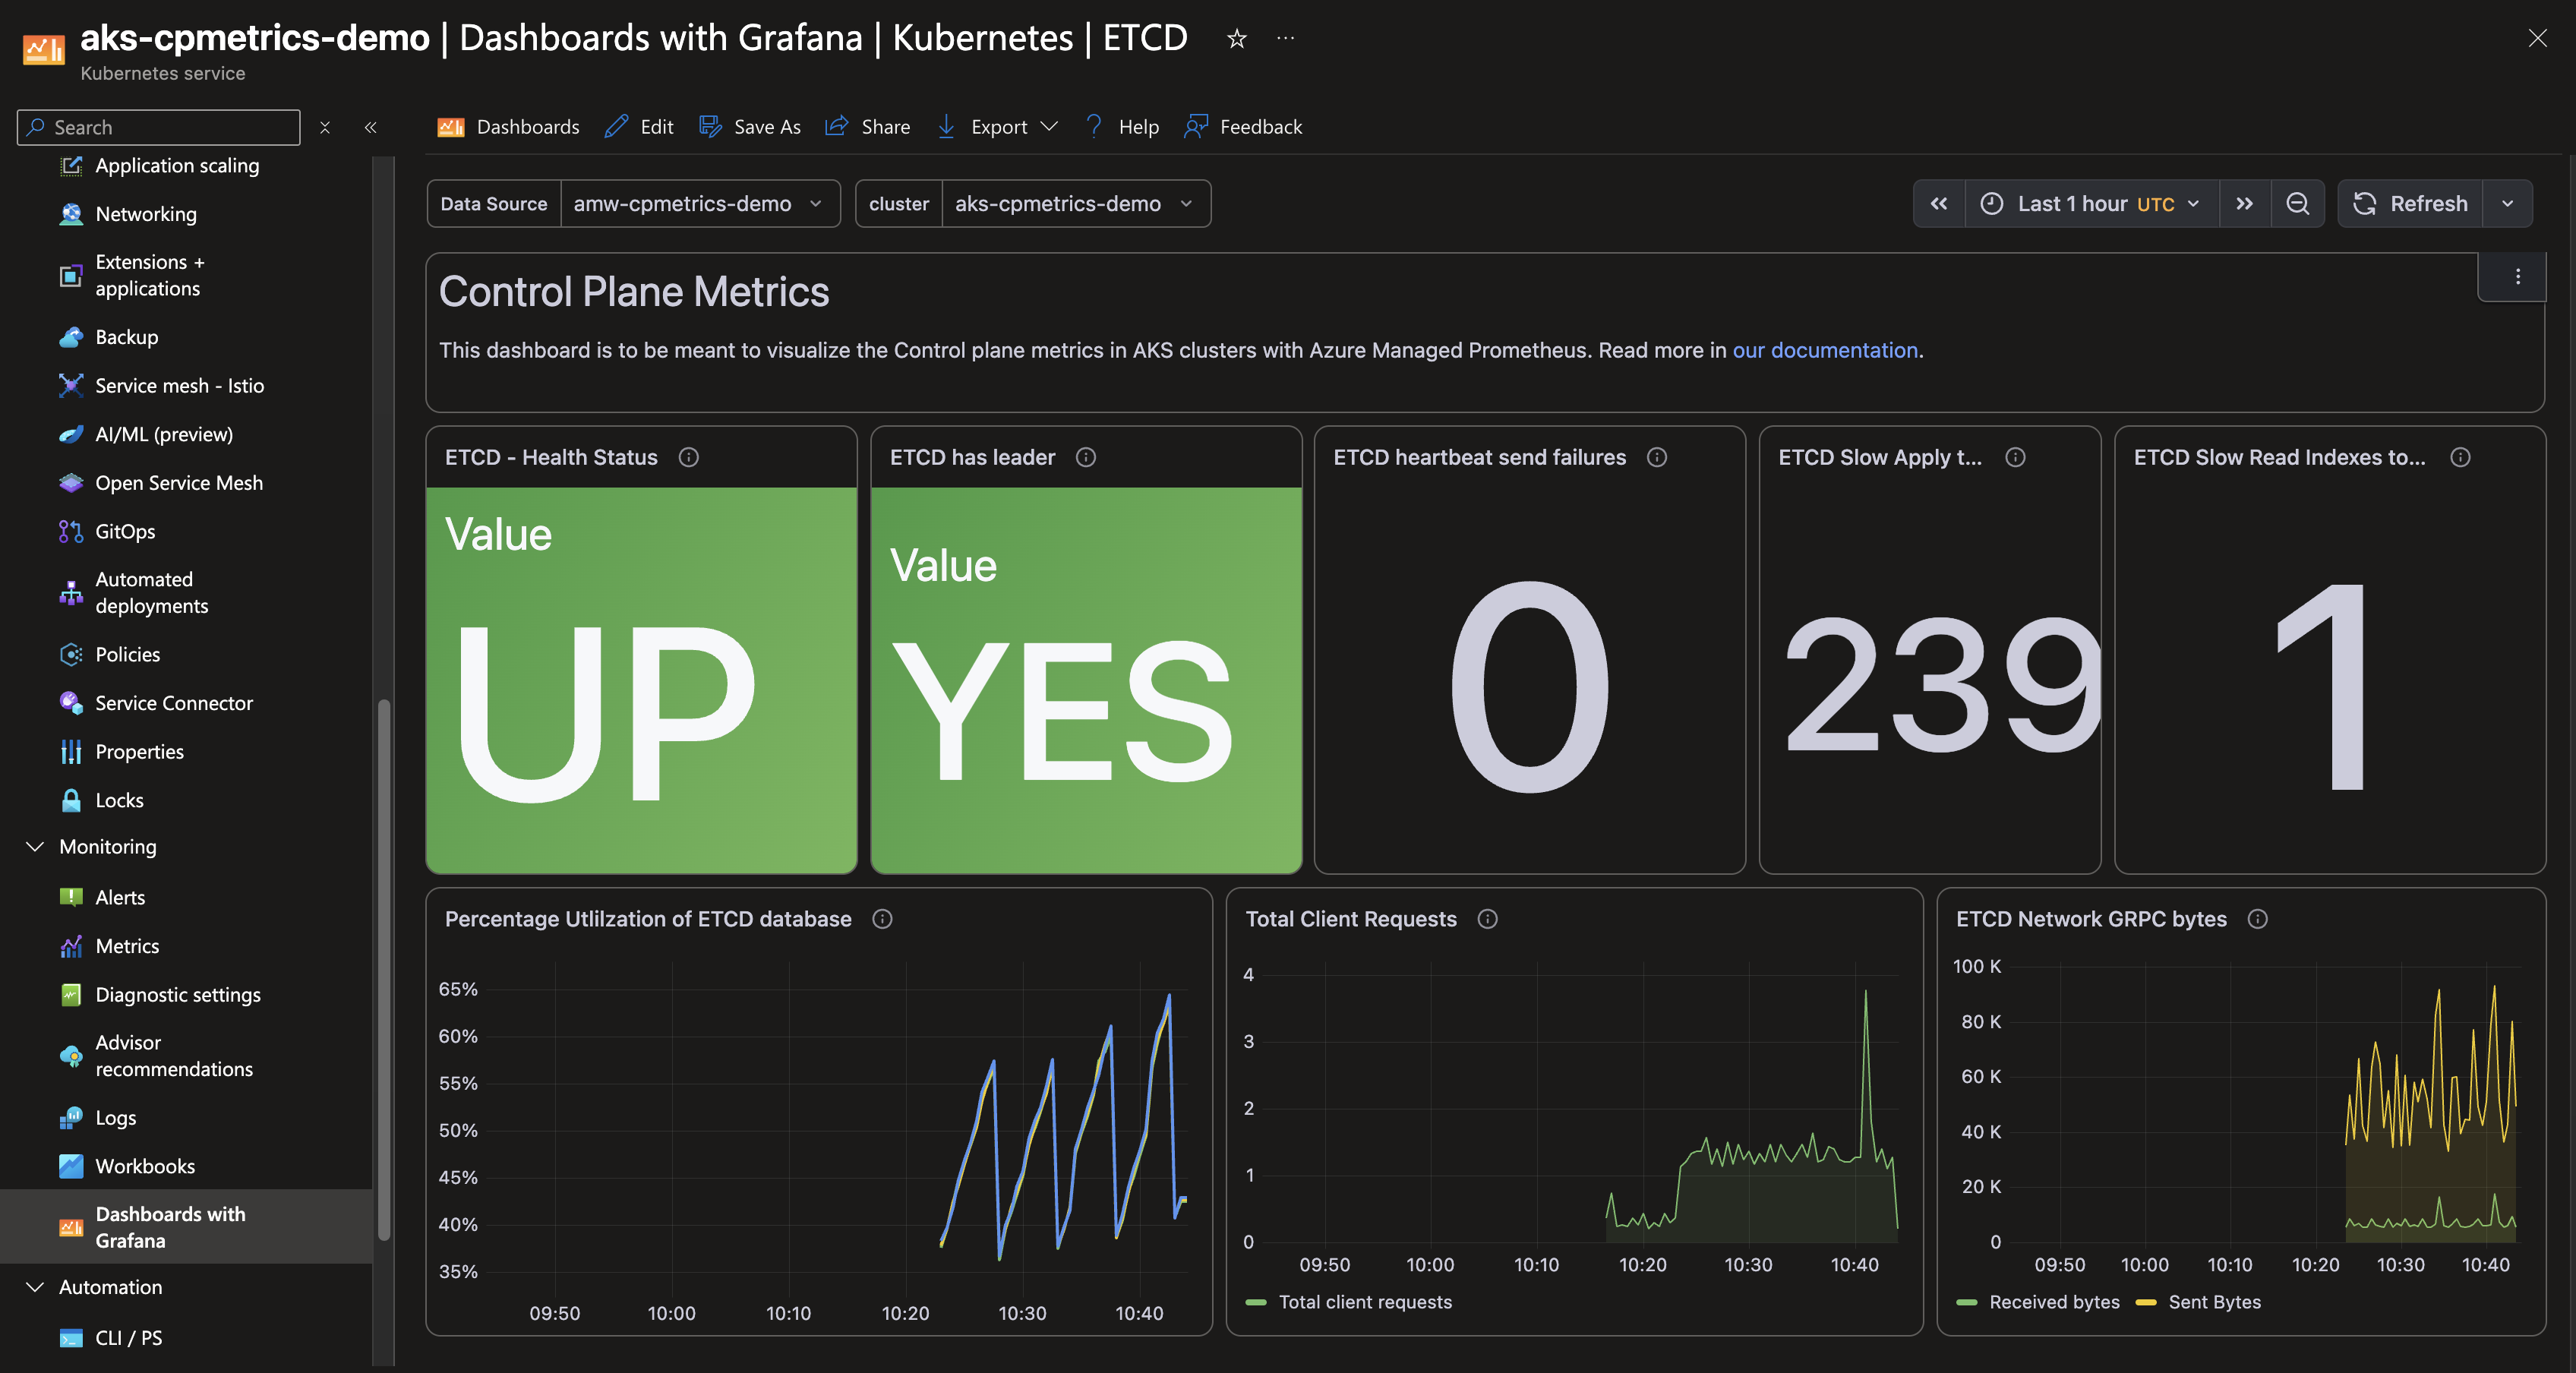
The demo imports the Grafana Labs dashboards for Kubernetes / API Server and Kubernetes / ETCD. Select the Managed Prometheus data source and the right cluster when opening them.
Here is the etcd dashboard from the demo, showing leader and health panels alongside database utilization and client traffic:
You can also try PromQL in Grafana Explore. These queries rely on the relevant targets being enabled and the metrics being retained by the configured ingestion profile or keep-list:
# API request rate by verb
sum by (verb) (rate(apiserver_request_total[5m]))

# API server p99 request latency by verb
histogram_quantile(
  0.99,
  sum by (le, verb) (
    rate(apiserver_request_duration_seconds_bucket[5m])
  )
)

# Current in-flight API requests
apiserver_current_inflight_requests

# etcd database size
etcd_mvcc_db_total_size_in_bytes

# Scheduler pending pods (requires the scheduler target)
scheduler_pending_pods
The demo’s optional load generator makes repeated API calls, lists pods, creates and deletes ConfigMaps, and requests an object that doesn’t exist. That creates visible API server request traffic and etcd writes. You can scale it during a test to compare dashboard behavior, but treat it as a test workload rather than a production load-testing method.
This short clip shows the API server dashboard in action:
Run the demo
The repository includes deploy.sh and cleanup.sh. It requires an Azure subscription with permission to create resources and role assignments, Azure CLI, Terraform, and kubectl. After signing in and reviewing the Terraform variables, you can run:
cd AKS-Control-Plane-Metrics
chmod +x deploy.sh cleanup.sh
./deploy.sh
The script provisions the infrastructure, obtains AKS credentials, applies the scrape ConfigMap, imports the dashboards, and starts the load generator. Use ./deploy.sh --skip-load if you want the infrastructure without that test workload. Read the script and Terraform configuration before running them in your subscription, and review the cleanup script too: it is designed to destroy the demo resources and can delete the resource group.
Limitations and things to check
- Control plane Prometheus metrics are supported through Azure Monitor managed Prometheus; self-managed Prometheus scraping isn’t supported for these targets.
- Azure Monitor Private Link isn’t supported for this feature.
- The cluster must use managed identity authentication. Service principal authentication isn’t supported.
- Only the default
ama-metrics-settings-configmapcan be customized for this collection. - The control plane collector is managed by AKS and isn’t visible as a workload in your cluster.
- A metric documented by AKS might not be exposed by a particular target or included in your ingestion profile. Check target enablement and the keep-list before assuming the collector is broken.
- Disabling the Prometheus add-on also stops collection of the other metrics that use it. Disable only control plane collection with
--disable-control-plane-metricsif you want to leave the add-on in place.