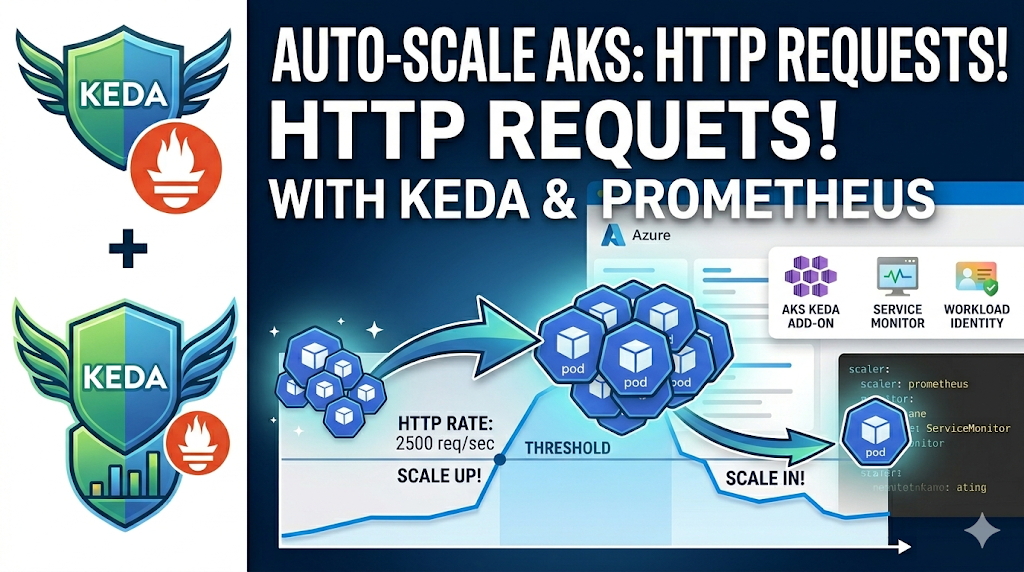

The Horizontal Pod Autoscaler that ships with Kubernetes scales on CPU and memory, and for many workloads that isn’t the right signal. A web service can be handling a lot of requests while its CPU sits at 30%, or it can be idle but still holding memory. Often the metric you actually want to scale on is something specific to the app — request rate, queue depth, latency, or a business metric — rather than resource utilisation.
That’s where KEDA helps. On AKS you don’t have to install it yourself: the KEDA add-on is a managed component you enable, and it works with the rest of the Azure stack. In this post I’ll connect the KEDA add-on to Azure Managed Prometheus and scale a Deployment based on its HTTP request rate, with authentication handled by Workload Identity so there are no bearer tokens to rotate.
This is the first post in a short series on the KEDA add-on. The accompanying repo has the full Terraform setup plus five scaler scenarios; here I’m focusing on scenario 03, the prometheus scaler.
Why Not Just Use the HPA?
The built-in HPA scales on resource utilisation. KEDA scales on events — and it does this by reading from a trigger source (a queue, a Prometheus query, a cron schedule) and translating that into a standard HPA behind the scenes. You don’t replace the HPA; KEDA drives it for you.
A few things follow from that design:
- A wide range of metrics works. Queue length, message lag, HTTP RPS, a PromQL expression — if you can measure it, you can scale on it.
- Scale-to-zero. When there’s no work, KEDA can take a Deployment down to zero replicas. The stock HPA can technically do this too, but only with the
HPAScaleToZerofeature gate, which is still alpha (and not something you can enable on AKS’s managed control plane). KEDA handles scale-to-zero itself, so you get it out of the box. - It’s still HPA underneath. KEDA creates and manages the HPA object, so what you already know about scaling behaviour, stabilisation windows, and
kubectl get hpastill applies.
For an HTTP service, the metric I want is requests per second. The app already exposes that as a Prometheus counter, so the task is getting that number in front of KEDA and letting it do the calculation.
What We’re Building
The demo scales a small Python HTTP server based on the request rate it’s serving. A load generator drives traffic up and down; KEDA watches the request rate via Azure Managed Prometheus and adjusts replicas between 1 and 10.
                                  Azure Managed Prometheus
                                 ┌──────────────────────┐
 Load Generator ──▶ sample-app ──▶│  scrapes /metrics    │
  (Deployment)      (Deployment)  │  via ServiceMonitor  │
                                 └──────────┬───────────┘
                                            │
                                KEDA queries PromQL every 15s
                                (Workload Identity → Azure AD token)
                                            │
                                 ┌──────────▼───────────┐
                                 │     ScaledObject      │
                                 │  threshold: 10 req/s  │
                                 │  per replica          │
                                 └──────────┬───────────┘
                                            │
                                      HPA adjusts
                                 sample-app replicas (1–10)
The pieces:
| Component | Role |
|---|---|
| sample-app | Python HTTP server exposing http_requests_total as a Prometheus counter on /metrics |
| ServiceMonitor | Tells the Azure Monitor metrics add-on (ama-metrics) to scrape the app’s /metrics endpoint |
| Azure Managed Prometheus | Stores the scraped metrics; queried by KEDA over PromQL |
| ScaledObject | The KEDA resource that maps the Prometheus query to the Deployment |
| TriggerAuthentication | Points KEDA at the managed identity it uses to authenticate to Prometheus |
| load-generator | A Deployment that produces continuous HTTP load — scale it to control traffic |
How It Works End to End
-
sample-app exposes
http_requests_totalas a Prometheus counter on/metrics. -
The Azure Monitor metrics add-on (
ama-metrics) scrapes that endpoint via aServiceMonitorCRD (azmonitoring.coreos.com/v1) and ships the samples to Azure Managed Prometheus. -
KEDA periodically runs a PromQL query against Azure Managed Prometheus:
sum(rate(http_requests_total{namespace="keda-demo"}[2m])) -
KEDA calculates the desired replica count as
ceil(queryResult / threshold):- 45 req/s →
ceil(45 / 10)= 5 replicas - 100 req/s →
ceil(100 / 10)= 10 replicas (capped at max) - 0 req/s → 1 replica (min)
Reference: Kubernetes HPA uses the core formula
desiredReplicas = ceil(currentReplicas × currentMetricValue / desiredMetricValue)(see HPA algorithm details). KEDA feeds metrics and targets into that HPA loop and, for most scalers including Prometheus, usesAverageValueby default (see KEDA ScaledObject spec - triggers.metricType and KEDA scaling concepts).In this demo:
threshold = 10 req/s per replica, so100 req/srequests roughly10replicas, then the result is bounded byminReplicaCountandmaxReplicaCount. - 45 req/s →
-
Authentication to Azure Managed Prometheus uses Workload Identity — no secrets, no manual token refresh (more on this below).
Authentication: Workload Identity, Not Bearer Tokens
This part is easy to get wrong, so it’s worth covering carefully. Azure Managed Prometheus is a protected endpoint — you can’t just curl it, you need an Azure AD token with the right role. One approach is to mint a bearer token and put it in a secret, but those expire, which leaves you with a rotation problem.
A better option is Azure AD Workload Identity, which lets the KEDA operator exchange its Kubernetes service account token for a short-lived Azure AD token automatically. The Terraform in the repo provisions three things to make that work:
- A User-Assigned Managed Identity with the Monitoring Data Reader role on the Prometheus workspace.
- A Federated Identity Credential that trusts the subject
system:serviceaccount:kube-system:keda-operator— the service account the KEDA add-on’s operator runs as. - The role assignment that grants that identity read access to the Prometheus query endpoint.
With that in place, KEDA presents its projected service account token, Azure AD validates it against the federated credential, and returns an access token scoped to read Prometheus. There’s nothing to rotate on your side, and there are no secrets in the cluster.
On the KEDA side, two manifests tie it together. The TriggerAuthentication declares the auth mode:
apiVersion: keda.sh/v1alpha1
kind: TriggerAuthentication
metadata:
  name: prometheus-auth
  namespace: keda-demo
spec:
  podIdentity:
    provider: azure-workload
    identityId: <PROMETHEUS_WORKLOAD_IDENTITY_CLIENT_ID>
And the ScaledObject references it from its trigger:
apiVersion: keda.sh/v1alpha1
kind: ScaledObject
metadata:
  name: prometheus-scaler
  namespace: keda-demo
spec:
  scaleTargetRef:
    name: sample-app
  minReplicaCount: 1
  maxReplicaCount: 10
  pollingInterval: 15
  cooldownPeriod: 90
  triggers:
    - type: prometheus
      metadata:
        serverAddress: <PROMETHEUS_QUERY_ENDPOINT>
        query: sum(rate(http_requests_total{namespace="keda-demo"}[2m]))
        threshold: "10"
      authenticationRef:
        name: prometheus-auth
Two values get substituted in at deploy time — the Prometheus query endpoint and the managed identity client ID — both of which come straight out of Terraform outputs.
Deploying It
The repo ships a deploy.sh that handles the setup. It runs Terraform to create the AKS cluster, the Azure Monitor Workspace, the managed identity, and the federated credential, then applies the scenario manifests with the right values substituted in.
# From the AKS-KEDA-Demo folder
./deploy.sh --demo prometheus
The sample app uses python:3.12-slim directly, so there’s no image to build. If you’d rather apply the manifests yourself — assuming the infrastructure already exists — fetch the Terraform outputs and substitute them in:
# 1. Get the Terraform outputs
cd terraform
PROMETHEUS_ENDPOINT=$(terraform output -raw prometheus_query_endpoint)
WI_CLIENT_ID=$(terraform output -raw prometheus_workload_identity_client_id)

# 2. Apply the manifests with the values substituted in
cd ../scenarios/03-prometheus
for f in 00-trigger-auth.yaml 01-sample-app.yaml 02-service.yaml \
         03-scaled-object.yaml 04-load-generator-job.yaml; do
  sed -e "s|{{ PROMETHEUS_QUERY_ENDPOINT }}|$PROMETHEUS_ENDPOINT|g" \
      -e "s|{{ PROMETHEUS_WORKLOAD_IDENTITY_CLIENT_ID }}|$WI_CLIENT_ID|g" \
      "$f" | kubectl apply -n keda-demo -f -
done
Once it’s up, confirm the KEDA add-on pods are running and the ScaledObject is healthy:
kubectl get pods -n kube-system | grep keda
kubectl get scaledobject prometheus-scaler -n keda-demo
You’re looking for READY=True and ACTIVE=True on the ScaledObject. READY=True means KEDA can reach Prometheus and the metric resolves; ACTIVE=True means the metric is currently above the activation threshold.
Behind the scenes, KEDA also creates the HPA that does the actual scaling. You can see it with the usual command:
kubectl get hpa -n keda-demo keda-hpa-prometheus-scaler
The keda-hpa- prefix and the Deployment/sample-app reference confirm KEDA wired the HPA to the right workload. The TARGETS column shows the current per-replica request rate against the threshold (here 5792m/10, i.e. ~5.8 req/s versus the target of 10) — this is the external metric KEDA’s metrics server feeds the HPA.
Watching It Scale
The load generator starts at 1 replica, and each replica sends ~30 concurrent requests in a tight loop. Scale the generator up and the traffic scales with it.
Scale out
# Drive ~150 req/s (5 generators × ~30 req/s each)
kubectl scale deployment load-generator -n keda-demo --replicas=5

# Watch the HPA react — it updates every 15s
kubectl get hpa -n keda-demo -w
Within about 30–60 seconds the sample-app Deployment reaches its ceiling of 10 replicas. At ~150 req/s the calculation is ceil(150 / 10) = 15, which clamps to the maxReplicaCount of 10.
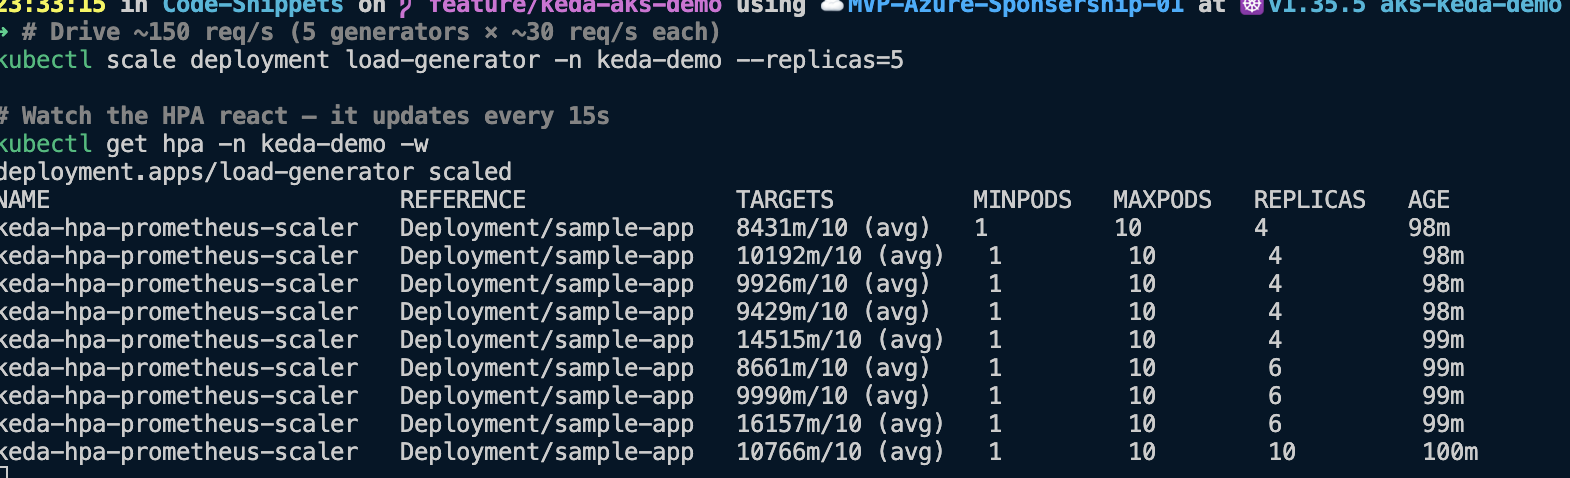
In the TARGETS column you can watch the average request rate per replica (for example 8431m/10, i.e. ~8.4 req/s against the target of 10) and see REPLICAS step up — 4, then 6, then 10 — as the load keeps climbing.
Scale back in
# Stop the traffic
kubectl scale deployment load-generator -n keda-demo --replicas=0

# Watch it drain (this is slower — give it a few minutes)
kubectl get hpa -n keda-demo -w
Scale-in is slower than scale-out by design, for two reasons. First, the PromQL rate(...[2m]) window has to drain — the average request rate decays over that two-minute window rather than dropping to zero instantly. Then KEDA’s 90-second cooldownPeriod has to elapse on top of that before it removes the last of the extra replicas. That asymmetry is intentional: you generally want to add capacity quickly and remove it cautiously, so a brief lull doesn’t cause repeated scale-down/scale-up cycles.
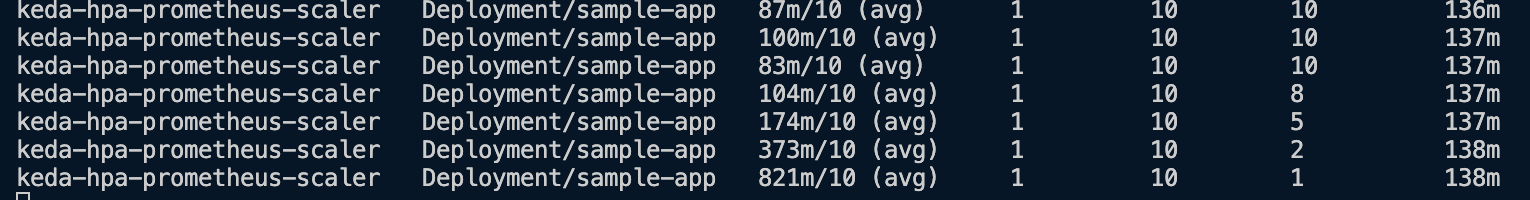
Notice the TARGETS value actually rises on the way down — 87m then 100m, 174m, 373m, 821m — because it’s an average per replica, and as replicas are removed the residual traffic is spread across fewer pods. KEDA keeps stepping REPLICAS down (10 → 8 → 5 → 2 → 1) until the metric settles below the threshold and it reaches minReplicaCount.
Confirm the metric is flowing
There are a few places to check that the request rate is actually making it from the app, through the metrics add-on, into Azure Managed Prometheus, and out to KEDA.
Is the app exposing /metrics correctly? Before checking scrape targets, you can verify the source endpoint directly:
# Port-forward the app service locally
kubectl port-forward -n keda-demo svc/sample-app 8000:8000
# In another terminal, confirm the Prometheus endpoint responds
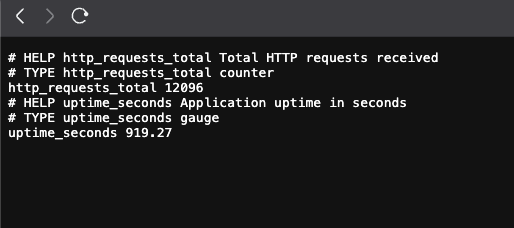
curl -s http://localhost:8000/metrics | head -20You should see Prometheus-formatted metrics including the http_requests_total counter that the scaler query uses.
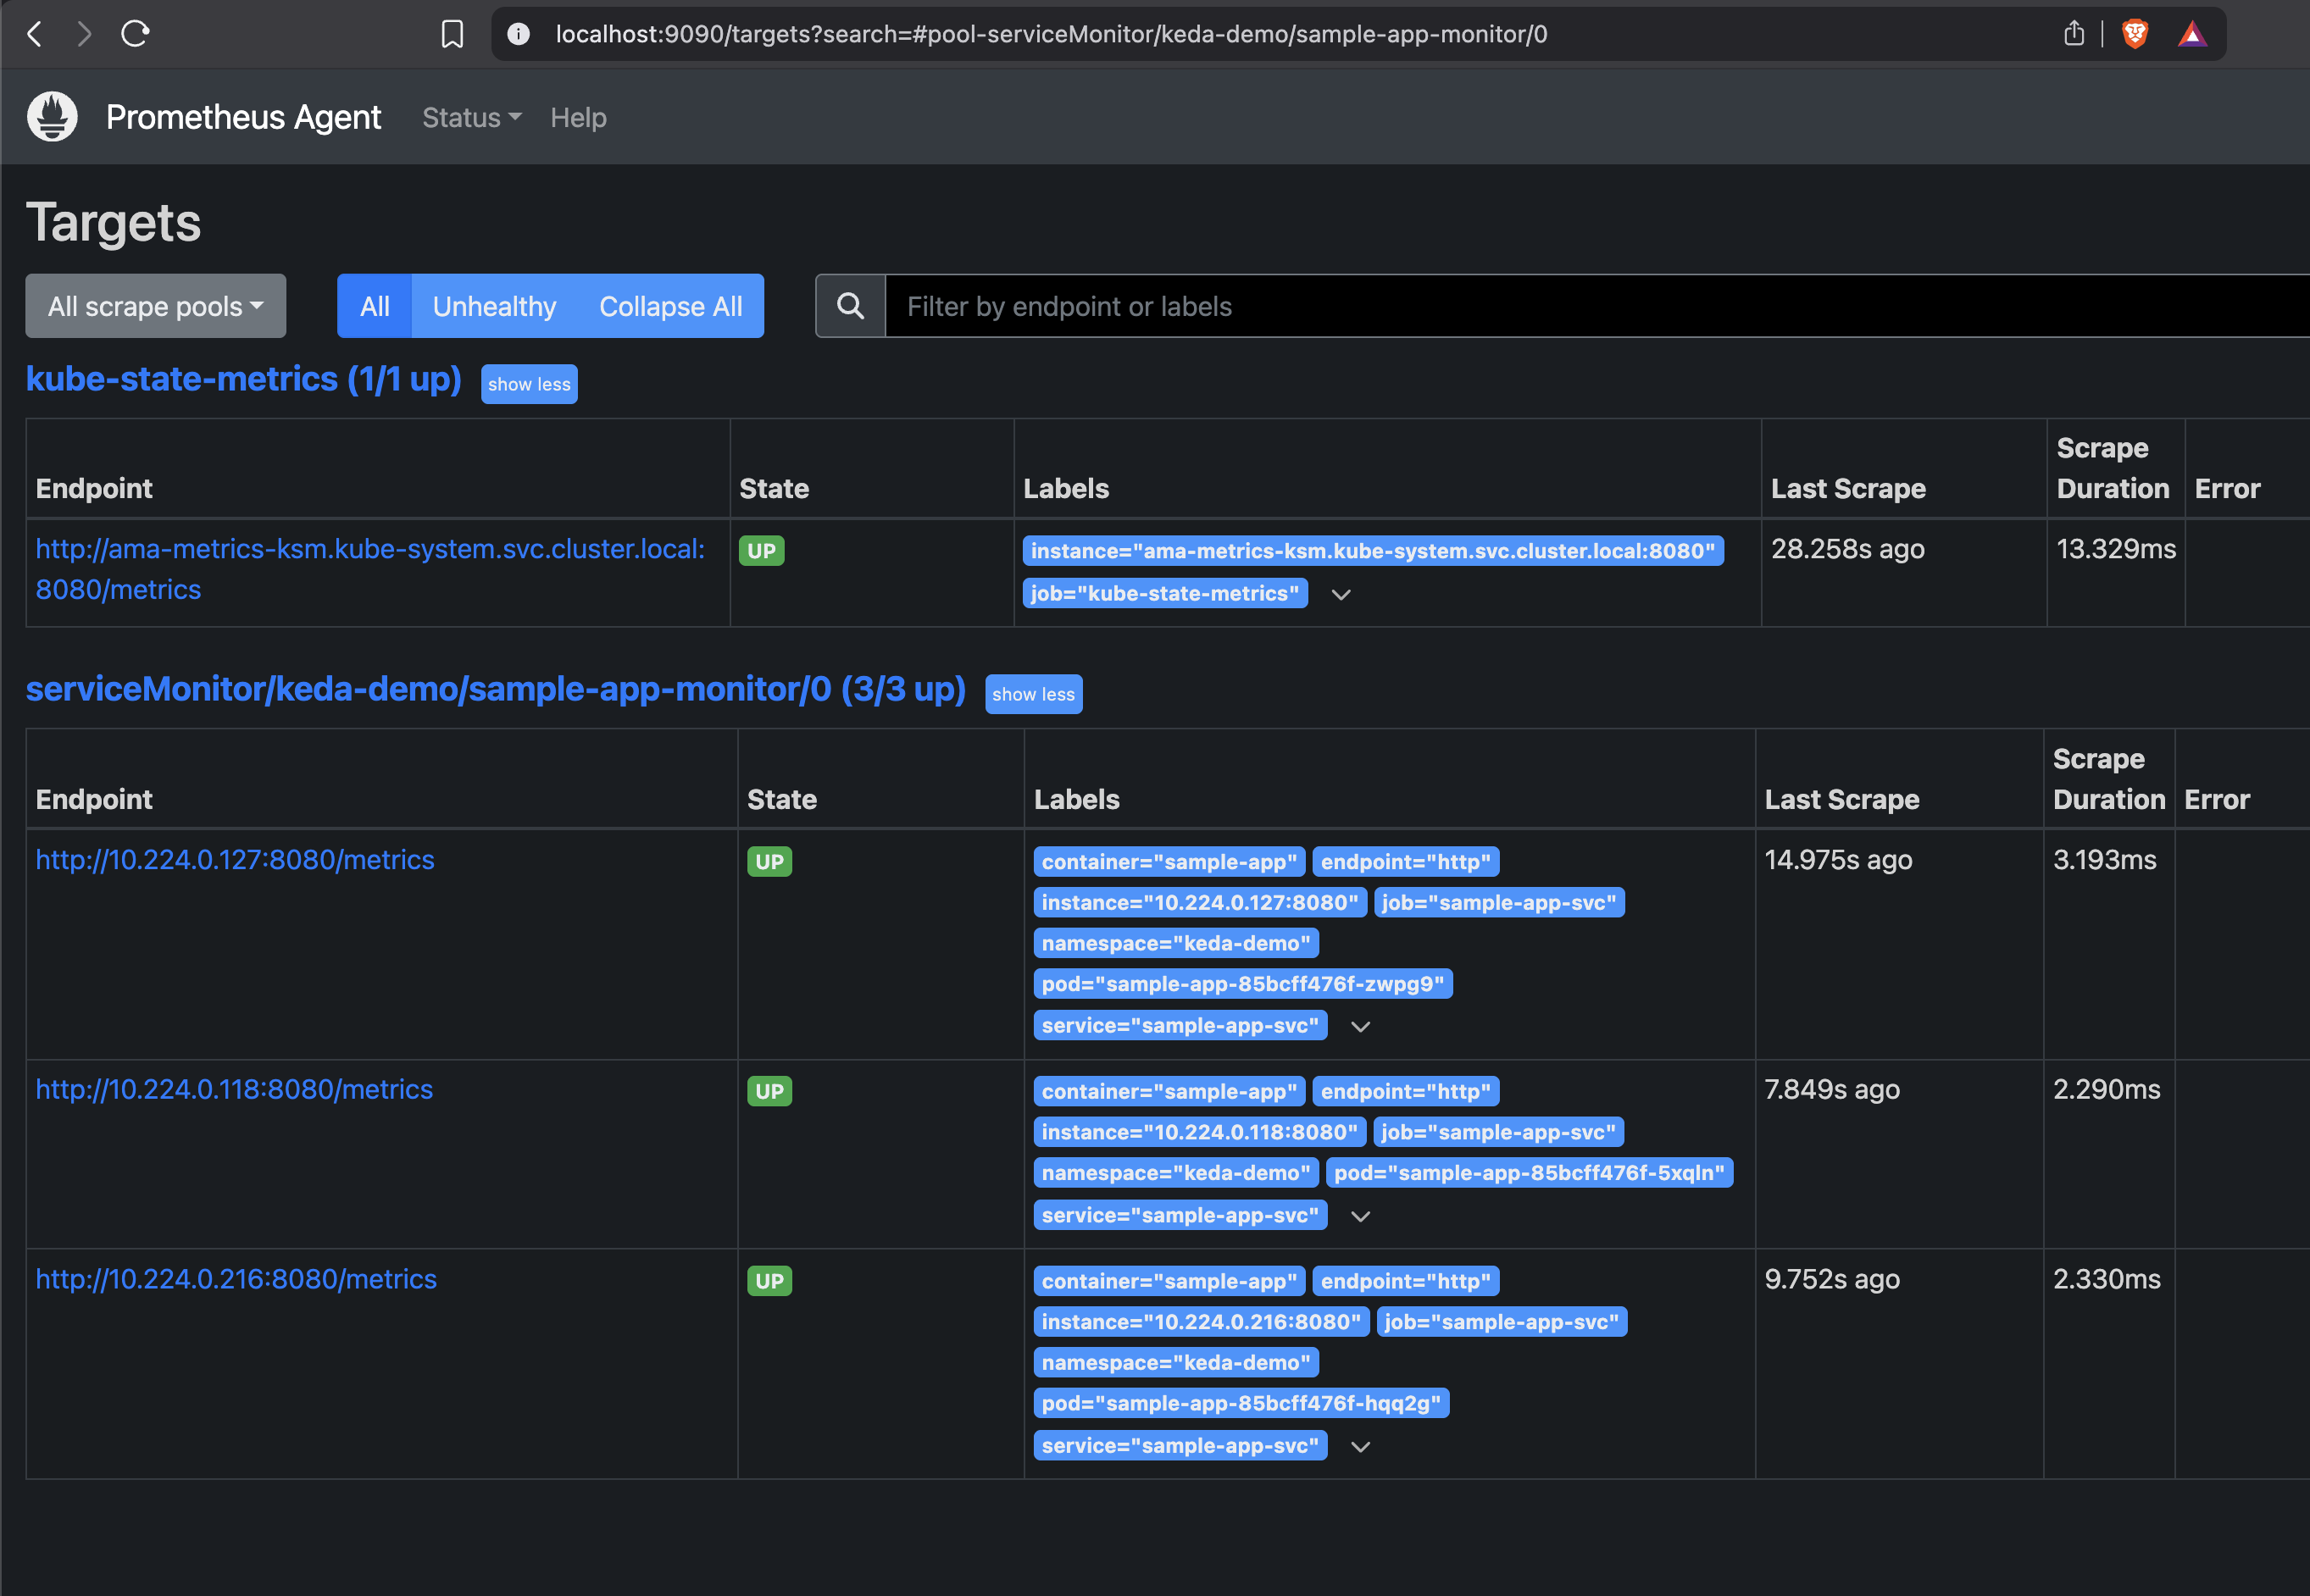
Is the add-on scraping the app? The metrics add-on (ama-metrics) runs a Prometheus Agent, and its targets page tells you whether the ServiceMonitor was picked up. Port-forward the pod and open the UI:
# Grab an ama-metrics pod name
kubectl get pods -n kube-system | grep ama-metrics

# Port-forward its Prometheus Agent UI (use a pod name from above)
kubectl port-forward -n kube-system ama-metrics-<pod-suffix> 9090
Then open http://localhost:9090/targets. You’re looking for the serviceMonitor/keda-demo/sample-app-monitor pool with all endpoints UP — one per sample-app replica.
Did the data land in the workspace? Open the Azure Monitor workspace in the portal and go to Prometheus explorer, then run the same query KEDA uses. If you see a line moving, the metric is being ingested and is queryable — which is exactly what the scaler depends on.
sum(rate(http_requests_total{namespace="keda-demo"}[2m]))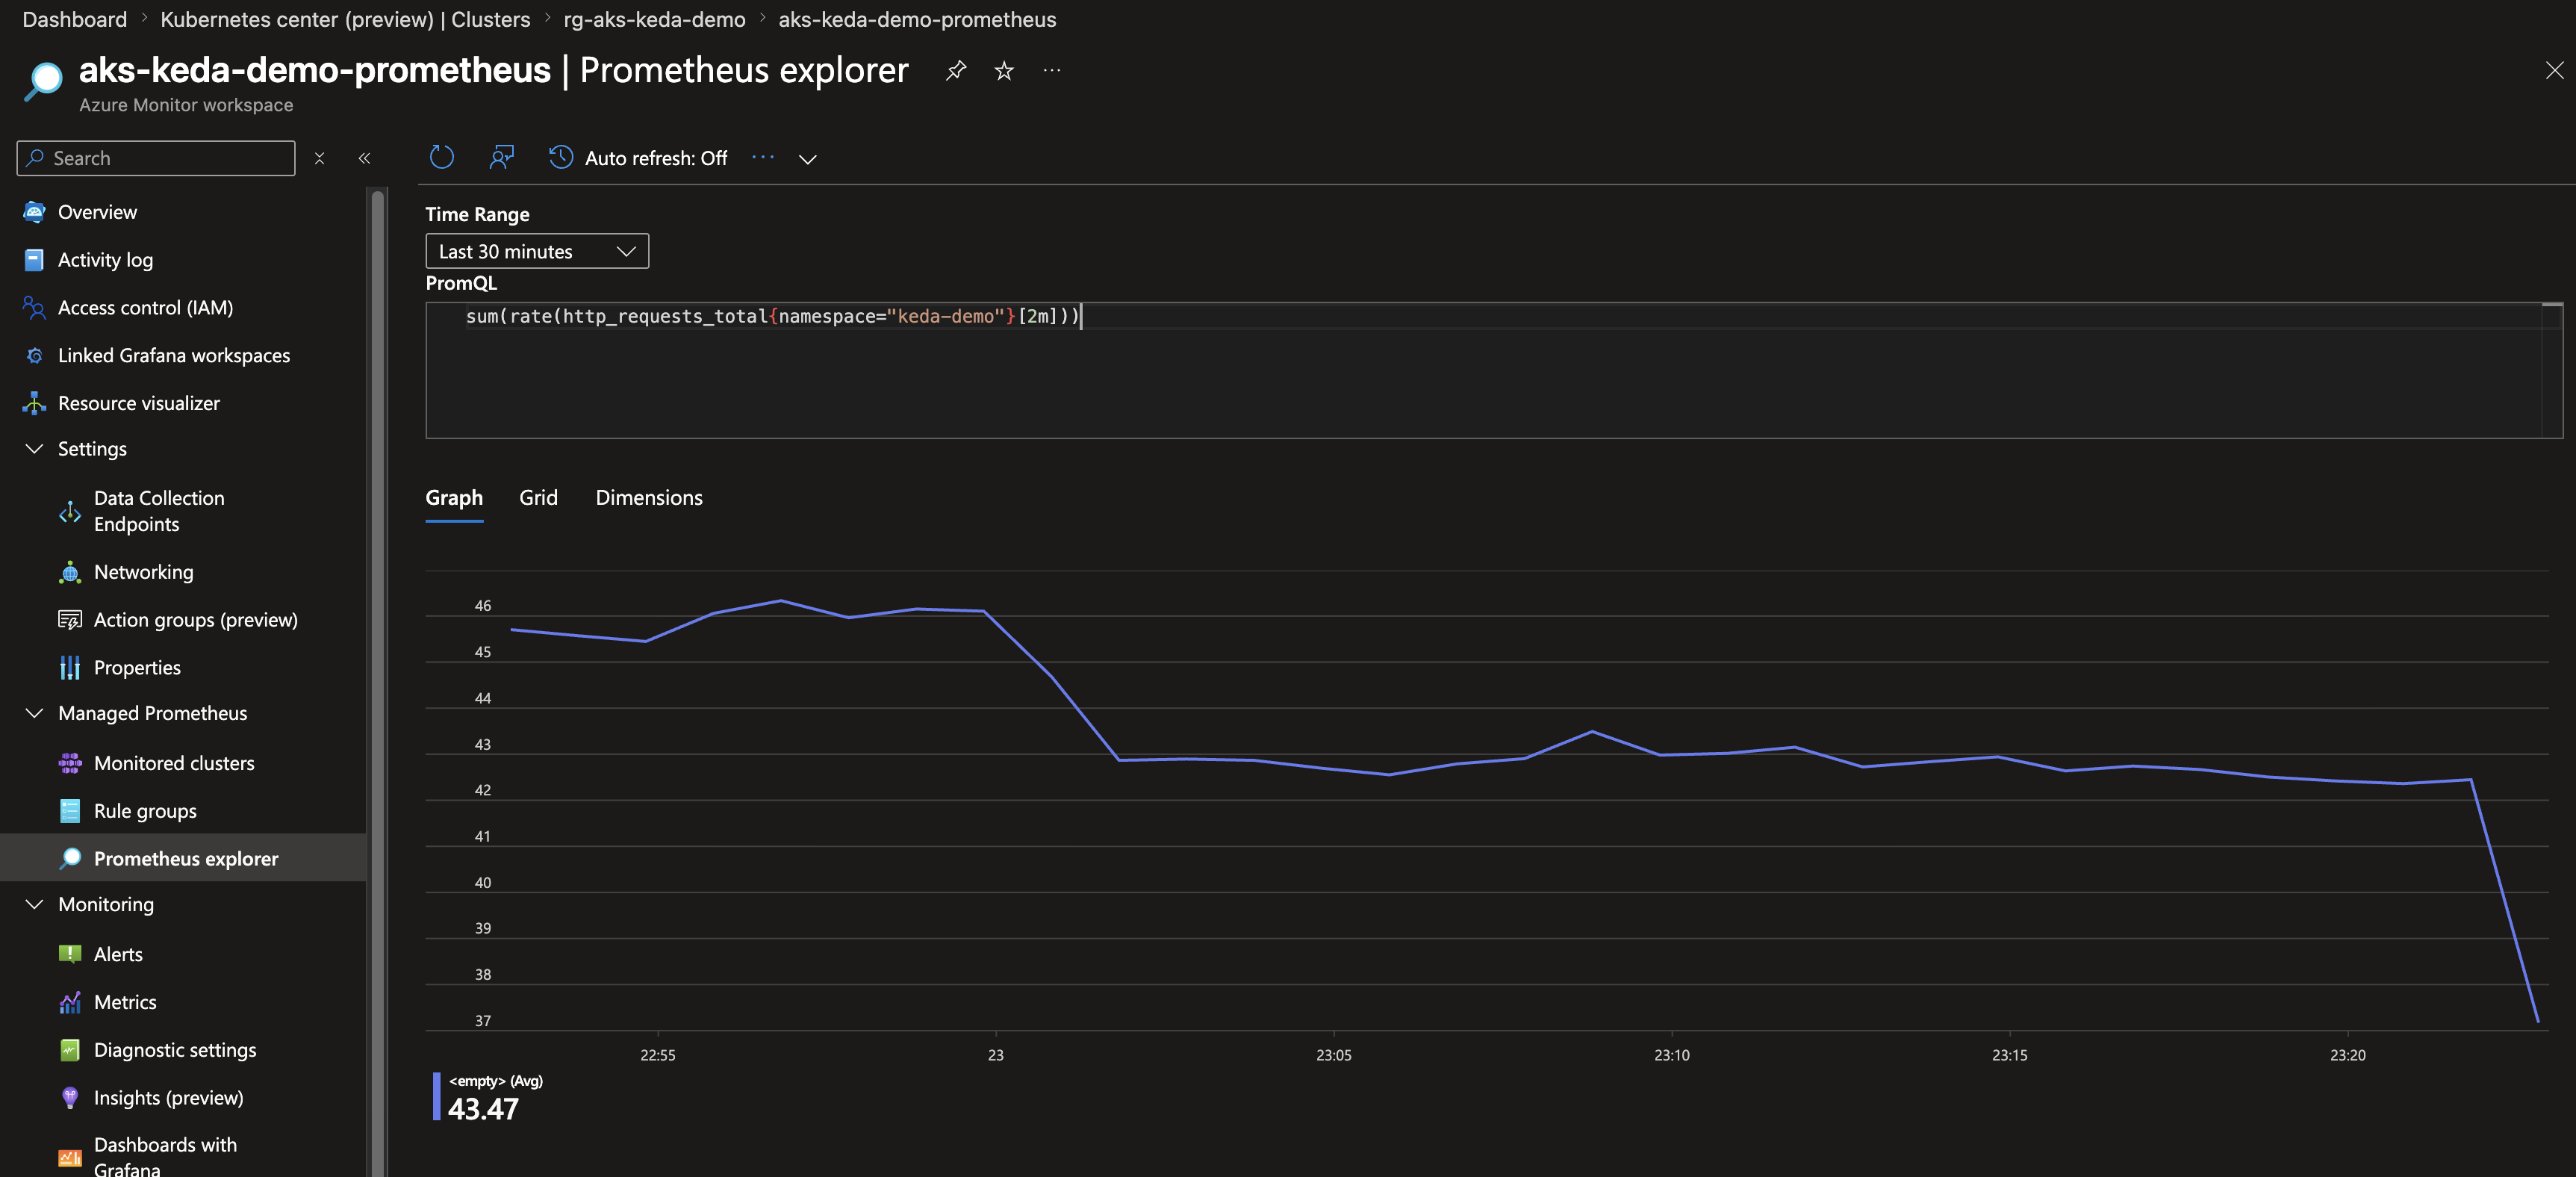
Prefer the command line? You can run the same query against the endpoint directly. You’ll need a token scoped to Prometheus:
PROMETHEUS_ENDPOINT=$(terraform -chdir=terraform output -raw prometheus_query_endpoint)
TOKEN=$(az account get-access-token \
  --resource https://prometheus.monitor.azure.com \
  --query accessToken -o tsv)

# Normalize endpoint in case output already includes /api/v1
PROM_BASE="${PROMETHEUS_ENDPOINT%/}"
PROM_BASE="${PROM_BASE%/api/v1}"

curl -fsS --get \
  -H "Authorization: Bearer $TOKEN" \
  "$PROM_BASE/api/v1/query" \
  --data-urlencode 'query=sum(rate(http_requests_total{namespace="keda-demo"}[2m]))' \
  | python3 -m json.tool
The Knobs Worth Knowing
Most of the behaviour lives in 03-scaled-object.yaml. These are the values you’ll most often adjust:
| Parameter | Default | What it does |
|---|---|---|
threshold | 10 | Target req/s per replica. Lower = more aggressive scaling |
pollingInterval | 15 | How often (seconds) KEDA queries Prometheus |
cooldownPeriod | 90 | Seconds to wait before scaling down after the metric drops |
minReplicaCount | 1 | Minimum replicas (set to 0 for scale-to-zero) |
maxReplicaCount | 10 | Maximum replicas |
[2m] in the query | 2m | PromQL rate window — longer is smoother but reacts slower |
interval (in 02-service.yaml) | 15s | How often the Azure Monitor metrics add-on scrapes the app |
The scaling formula, for reference:
desiredReplicas = ceil( sum(rate(http_requests_total{namespace="keda-demo"}[2m])) / threshold )clamped to [minReplicaCount, maxReplicaCount].
The relationship between threshold and the [2m] rate window is where most of the tuning happens. A tighter window reacts faster but is jumpier; a lower threshold scales out sooner but uses more replicas for the same traffic. There’s no single correct answer — it depends on how spiky your traffic is and how much you’re willing to over-provision to absorb bursts.
When Things Don’t Work
A few failure modes I hit (or expect you might), and what they usually mean:
ScaledObject shows READY=False. Describe it and check the conditions:
kubectl describe scaledobject prometheus-scaler -n keda-demo
kubectl logs -n kube-system -l app=keda-operator --tail=50 | grep -i "error\|failed"| Symptom | Cause | Fix |
|---|---|---|
missing required parameter "serverAddress" | The {{ PROMETHEUS_QUERY_ENDPOINT }} placeholder wasn’t substituted | Re-run ./deploy.sh --demo prometheus, or confirm terraform output -raw prometheus_query_endpoint is non-empty |
AADSTS700213: No matching federated identity record | Federated credential subject mismatch | Ensure the credential’s subject is exactly system:serviceaccount:kube-system:keda-operator |
401 Unauthorized (no AADSTS700213) | Missing role assignment | Grant the managed identity Monitoring Data Reader on the Prometheus workspace |
Metrics return 0 / no data. Check that the ServiceMonitor exists and that the app is actually receiving traffic:
kubectl get servicemonitor -n keda-demo
kubectl logs -l app=sample-app -n keda-demo --tail=5
HPA shows <unknown>/10. This is normal for the first polling interval or two after creation, while KEDA’s metrics server reports the external metric for the first time. If it persists, check the KEDA metrics server is up:
kubectl get pods -n kube-system | grep keda-metricsVisualising It in Grafana
The Terraform also sets up an Azure Managed Grafana instance linked to the Prometheus workspace, which is useful for watching the scaling happen rather than reading numbers off kubectl:
- Open the Grafana URL printed by
deploy.sh. - Sign in with your Azure AD credentials.
- Go to Dashboards → Azure Managed Prometheus → Kubernetes / Workload.
- Filter by namespace
keda-demoto watch the request rate and replica count move together in real time.
Cleanup
Tear down just this scenario, or the whole thing:
# Remove only the prometheus scenario
kubectl delete -f scenarios/03-prometheus/ -n keda-demo

# Or remove every demo plus all the Azure infrastructure
./cleanup.sh
Why I Like This Pattern
What I like about the KEDA add-on here isn’t the scaling itself — the plain HPA could scale on a custom metric too, with enough adapter plumbing. It’s how little of that plumbing I had to set up. The add-on is managed, Azure Managed Prometheus is managed, and Workload Identity means there’s no secret or token in the cluster to rotate. The authentication step — usually the most tedious part of connecting an external metric source to Kubernetes — comes down to a federated credential and a role assignment that Terraform sets up once.
And because KEDA is driving a normal HPA underneath, none of this is a special case. What you already know about Kubernetes autoscaling still applies; KEDA just feeds it a different signal.
That’s scenario 03. The same ScaledObject + TriggerAuthentication shape carries across the other scalers in the repo — Storage Queue, Cron, CPU/Memory, and Event Hub — only the trigger block changes. I’ll cover more of those in later posts in this series.
Further Reading
- KEDA Documentation — the project docs
- AKS KEDA Add-on — enabling and managing the add-on
- KEDA Prometheus Scaler — the trigger reference
- KEDA TriggerAuthentication — auth concepts, including pod identity
- Azure Managed Prometheus — the managed metrics store
- Azure AD Workload Identity on AKS — how the token exchange works