
Kubernetes is an excellent platform for running workloads, but its flexibility is also what makes it a target. An attacker who gets a foothold inside a container can move laterally, exfiltrate secrets, or establish persistence — and without proper runtime visibility, none of that is observable.
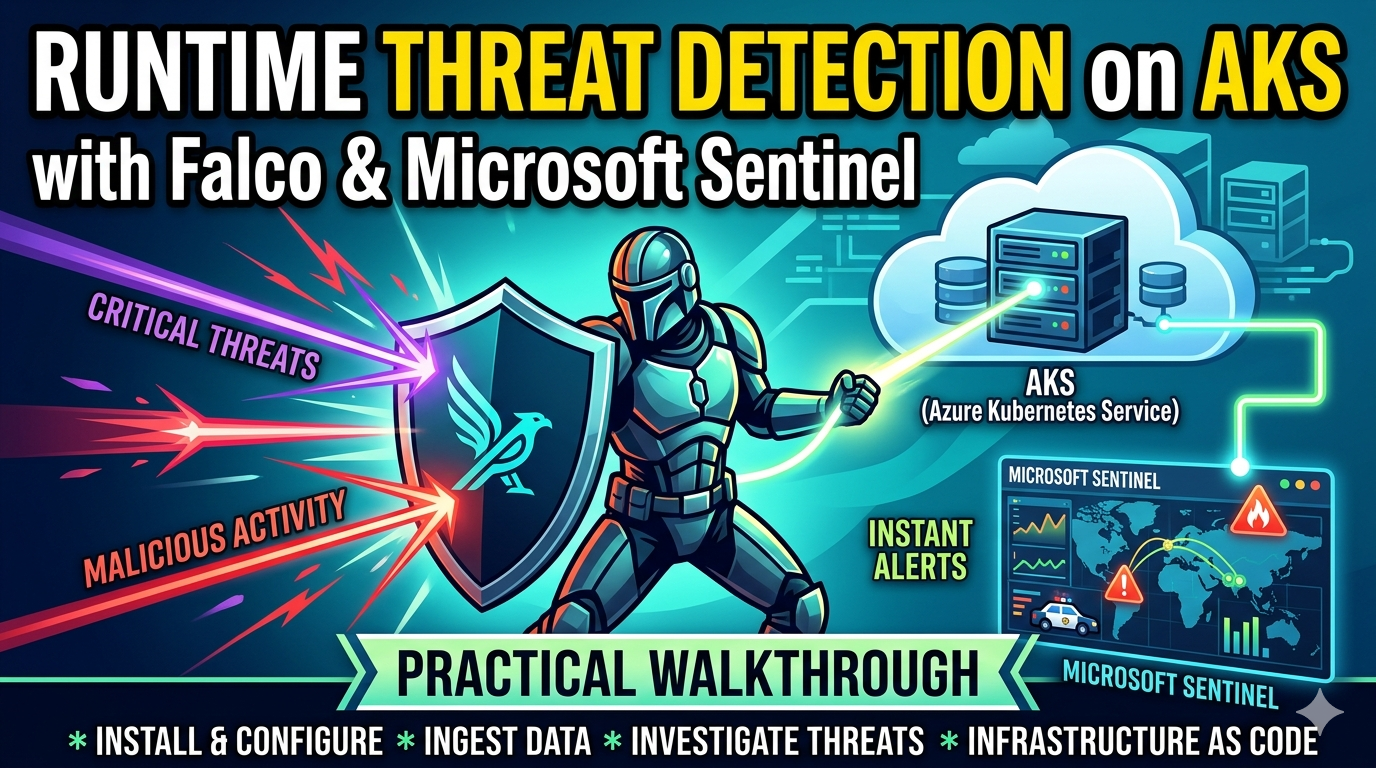
In this post I’ll walk through a complete, production-inspired setup that uses Falco to detect suspicious behaviour at the kernel level inside AKS, and streams those findings to Microsoft Sentinel for correlation, alerting, and incident investigation. All infrastructure is defined as code using Bicep, and the demo repo has scripts for one-command deployment.
Why Runtime Security?
Most Kubernetes security tooling focuses on the build and deploy phases: scanning container images, validating manifests, enforcing admission policies. Those controls are valuable, but they stop at the container boundary.
Runtime security operates at a different layer. It watches what is actually happening inside running containers — which processes are being spawned, which files are being read, which network connections are being established — and raises an alert when something deviates from expected behaviour.
The classic attacks that runtime security catches include:
- A container spawning a shell (
/bin/sh,/bin/bash) after deployment — a common indicator of an interactive intrusion. cat /etc/shadowor reads from/proc— credential harvesting.- Package manager invocations (
apt,apk,yum) inside a running container — binary planting. - Outbound connections to unexpected hosts — command-and-control or data exfiltration.
- Reverse shell patterns —
nc -lor similar listener setup.
None of these are caught by image scanning or admission control, because they happen at runtime.
The Stack
| Component | Role |
|---|---|
| Falco | eBPF-based kernel-level syscall monitor running as a DaemonSet on every AKS node |
| Falcosidekick | Sidecar process that fans out Falco JSON alerts to one or many outputs |
| Azure Logic App | HTTP webhook endpoint that receives Falco alerts and forwards them to Log Analytics |
| Log Analytics Workspace | Centralised log store; auto-creates the FalcoLogs_CL custom table on first ingest |
| Microsoft Sentinel | SIEM layered on top of Log Analytics, with 5 pre-built analytics rules and incident tracking |
Architecture
graph TB
    subgraph AKS["AKS Cluster"]
        Falco["Falco\n(DaemonSet — eBPF driver)"]
        FSK["Falcosidekick\n(Forwarder)"]
        Falco -- "JSON alert" --> FSK
    end

    subgraph Azure["Azure"]
        LA["Logic App\n(HTTP Webhook)"]
        LAW["Log Analytics Workspace\nFalcoLogs_CL"]
        Sentinel["Microsoft Sentinel\n5 Analytics Rules"]
        FSK -- "HTTP POST" --> LA
        LA -- "Data Collector API" --> LAW
        LAW --> Sentinel
    end
The flow is deliberately simple:
- Falco runs as a DaemonSet on every node using the modern eBPF driver — no kernel module, no custom node configuration required on AKS.
- Falcosidekick reads the local Unix socket exposed by Falco and HTTP-POSTs each alert as JSON to the Logic App webhook URL.
- The Logic App passes the raw JSON payload straight to the Log Analytics Data Collector API, which auto-creates the
FalcoLogs_CLtable on first arrival. - Microsoft Sentinel continuously evaluates the 5 pre-imported analytics rules against
FalcoLogs_CLand raises Incidents when the query thresholds are met.
Infrastructure as Code
The entire Azure side is defined in Bicep. The repo is structured as follows:
Falco-AKS-Sentinel/
├── main.bicep                    # Entry point (resource-group scope)
├── main-subscription.bicep       # Entry point (subscription scope — used by scripts)
├── main-subscription.bicepparam  # Parameter file consumed by deployment scripts
├── modules/
│   ├── aks-cluster.bicep         # AKS cluster with Azure RBAC
│   ├── log-analytics.bicep       # Log Analytics workspace + Sentinel
│   └── logic-app.bicep           # Logic App webhook + Data Collector setup
├── k8s/
│   ├── falco-namespace.yaml
│   ├── falco-values.yaml         # Falco Helm values (eBPF, JSON output, custom rules)
│   ├── falcosidekick-config.yaml # Falcosidekick webhook config
│   └── sentinel-analytics-rules.json  # 5 pre-built KQL rules
└── scripts/
    ├── deploy.sh                 # One-command deploy
    ├── cleanup.sh                # Tear down all resources
    └── simulate-attacks.sh       # 7 rogue-actor attack scenarios
AKS Cluster
The AKS cluster is created with:
- Kubernetes 1.33 with three
Standard_D2s_v3system nodes - Azure CNI networking
- Azure RBAC for Kubernetes authorisation (the deploying user gets
Azure Kubernetes Service RBAC Cluster Adminautomatically) - Container Insights diagnostic settings wired to the same Log Analytics workspace
Log Analytics and Sentinel
resource logAnalyticsWorkspace 'Microsoft.OperationalInsights/workspaces@2022-10-01' = {
  name: workspaceName
  location: location
  properties: {
    retentionInDays: 30
    sku: {
      name: 'PerGB2018'
    }
  }
}

resource sentinel 'Microsoft.SecurityInsights/onboardingStates@2022-12-01-preview' = {
  name: 'default'
  scope: logAnalyticsWorkspace
}
Logic App Webhook
The Logic App uses an HTTP trigger to receive the Falco JSON payload and forwards it to the Log Analytics Data Collector API (https://<workspace-id>.ods.opinsights.azure.com/api/logs). There is no transformation — the raw JSON is passed through, and Log Analytics creates the column schema automatically from the first payload it receives.
Deploying the Infrastructure
Prerequisites
- Azure CLI 2.30+
kubectl1.25+- Helm 3.0+
jq(used for Sentinel rules import)openssl(deployment name suffix generation)uuidgen(deployment script)sha1sum(GNU coreutils) orshasum(Perl) for deterministic Sentinel rule IDs- An Azure subscription with permission to create resource groups and resources
One-command deploy
git clone https://github.com/kasunsjc/Code-Snippets.git
cd Code-Snippets/Falco-AKS-Sentinel
chmod +x scripts/*.sh
./scripts/deploy.sh
The script supports several flags:
| Flag | Description |
|---|---|
| (none) | Full deploy: infra → Falco → wait for logs → Sentinel rules |
--enable-rules | Re-import Sentinel rules only (no infra/Falco changes) |
--skip-rules | Deploy infra + Falco only; skip Sentinel rules |
--no-wait | Skip the FalcoLogs_CL population gate |
--wait-timeout <min> | Override the wait timeout (default: 20 minutes) |
Resource naming: The script appends a random 6-character hex suffix to every resource name (e.g.
rg-falco-demo-a3f9c1,aks-falco-demo-a3f9c1) so re-deployments never collide. The suffix is printed at the start of each run.
The script will:
- Create the resource group in East US.
- Deploy the Bicep template (AKS + Log Analytics + Logic App).
- Get AKS credentials and set the kubectl context.
- Install Falco and Falcosidekick via Helm.
- Patch Falcosidekick with the Logic App webhook URL.
- Import 5 Sentinel analytics rules via the Sentinel REST API.
To customise the deployment — cluster name, region, node size — edit main-subscription.bicepparam before running the script.
Installing Falco on AKS
Once the cluster is up, Falco is installed via Helm into its own namespace:
helm repo add falcosecurity https://falcosecurity.github.io/charts
helm repo update

helm install falco falcosecurity/falco \
  --namespace falco \
  --create-namespace \
  --values k8s/falco-values.yaml
The key parts of falco-values.yaml:
driver:
  kind: modern_ebpf   # No kernel module required on AKS

falco:
  json_output: true   # Emit alerts as JSON (required by Falcosidekick)
  priority: debug     # Capture everything debug and above

falcosidekick:
  enabled: true
  config:
    webhook:
      address: ""     # Populated by the deploy script with the Logic App URL
Custom rules are included for AKS-specific scenarios that Falco’s default ruleset does not cover:
| Rule | What it detects |
|---|---|
| Unauthorized Process in Container | Any process spawned that isn’t in an allowlist |
| Read Sensitive File Untrusted | Reads of /etc/shadow, /etc/passwd, /root/.ssh/* |
| K8s Secret Accessed in Container | A process reading a Kubernetes secret from the filesystem |
| Package Manager Executed | apt, apk, yum, dnf executed at runtime |
| Reverse Shell Detected | nc with -l flag or similar listener patterns |
Sentinel Analytics Rules
The deployment auto-imports five Scheduled Query Rules into Sentinel. Each runs on a KQL query against FalcoLogs_CL.
1. Critical Security Alert
FalcoLogs_CL
| where priority_s == "Critical"
| project TimeGenerated,
    PodName    = output_fields_k8s_pod_name_s,
    Namespace  = output_fields_k8s_ns_name_s,
    Rule       = rule_s,
    Output     = output_s
Severity: High | Frequency: Every 5 minutes
2. Suspicious Process Execution
FalcoLogs_CL
| where rule_s contains "Process"
    or rule_s contains "Shell"
| project TimeGenerated,
    PodName   = output_fields_k8s_pod_name_s,
    Container = output_fields_container_id_s,
    Rule      = rule_s,
    Output    = output_s
Severity: Medium | Frequency: Every 10 minutes
3. Sensitive File Access
FalcoLogs_CL
| where rule_s contains "Sensitive"
    or rule_s contains "Secret"
| project TimeGenerated,
    PodName  = output_fields_k8s_pod_name_s,
    User     = output_fields_user_name_s,
    Rule     = rule_s,
    Output   = output_s
Severity: High | Frequency: Every 5 minutes
4. Reverse Shell Detection
FalcoLogs_CL
| where rule_s contains "Reverse Shell"
    or output_s contains "nc -l"
| project TimeGenerated,
    PodName  = output_fields_k8s_pod_name_s,
    Rule     = rule_s,
    Output   = output_s
Severity: High | Frequency: Every 5 minutes
5. Multiple Alerts from Same Pod
FalcoLogs_CL
| where TimeGenerated > ago(10m)
| summarize AlertCount = count() by output_fields_k8s_pod_name_s, rule_s
| where AlertCount > 5
| order by AlertCount desc
Severity: High | Frequency: Every 10 minutes
This rule catches pods that are generating a burst of security alerts — a strong indicator of a compromised or actively-exploited container.
Column Naming in FalcoLogs_CL
One thing worth understanding early is how Log Analytics names the columns in FalcoLogs_CL. Falco emits nested JSON like this:
{
  "priority": "Warning",
  "rule": "Read sensitive file untrusted",
  "output": "Sensitive file opened...",
  "output_fields": {
    "k8s.pod.name": "test-pod",
    "k8s.ns.name": "default",
    "container.id": "abc123",
    "user.name": "root"
  }
}
The Data Collector API flattens nested objects using underscores, and appends _s (string), _d (double), or _b (boolean) type suffixes. So output_fields.k8s.pod.name becomes output_fields_k8s_pod_name_s. Keep this in mind when writing your own KQL queries.
Testing the Setup
The repo ships with a simulate-attacks.sh script that runs 7 realistic attack scenarios against the cluster and automatically generates Falco detections:
# Run all scenarios
./scripts/simulate-attacks.sh

# Run a specific scenario
./scripts/simulate-attacks.sh --scenario sensitive-file
./scripts/simulate-attacks.sh --scenario crypto-miner
./scripts/simulate-attacks.sh --scenario reverse-shell

# Clean up attack namespaces afterwards
./scripts/simulate-attacks.sh --cleanup
Available scenarios: sensitive-file, package-mgmt, crypto-miner, reverse-shell, k8s-secrets, privileged-container, lateral-movement.
Alternatively, trigger alerts manually with a raw test pod:
# Spin up an Alpine pod
kubectl run test-pod --image=alpine --rm -it -- sh

# Inside the pod:
cat /etc/shadow          # Triggers: Read sensitive file untrusted
apk add curl             # Triggers: Package manager executed
nc -l -p 8080            # Triggers: Reverse shell detected (or outbound connection)
Then watch the Falco and Falcosidekick logs to confirm the alerts are being forwarded:
# Confirm Falco is detecting events
kubectl logs -n falco -l app.kubernetes.io/name=falco --tail=30

# Confirm Falcosidekick is forwarding to the Logic App
kubectl logs -n falco -l app.kubernetes.io/name=falcosidekick --tail=30
After 5–10 minutes (initial Log Analytics ingestion latency), run this KQL in the Log Analytics workspace:
FalcoLogs_CL
| where TimeGenerated > ago(1h)
| project TimeGenerated,
    PodName   = output_fields_k8s_pod_name_s,
    Namespace = output_fields_k8s_ns_name_s,
    Priority  = priority_s,
    Rule      = rule_s,
    Output    = output_s
| order by TimeGenerated desc
| take 50
Useful KQL Queries
Once data is flowing, a few queries are worth bookmarking.
Alert summary by severity and rule:
FalcoLogs_CL
| summarize Count = count() by priority_s, rule_s
| order by Count desc
Critical alerts by pod:
FalcoLogs_CL
| where priority_s == "Critical"
| summarize Count = count() by output_fields_k8s_pod_name_s, rule_s
| order by Count desc
Alert timeline (hourly buckets):
FalcoLogs_CL
| summarize Count = count() by bin(TimeGenerated, 1h), priority_s
| render timechart
Alerts by namespace (skip system noise):
FalcoLogs_CL
| where output_fields_k8s_ns_name_s != "kube-system"
| summarize Count = count() by output_fields_k8s_ns_name_s, priority_s
| order by Count desc
Azure Workbook: Security Event Dashboard
The repo also includes a pre-built Azure Monitor Workbook that gives you a visual overview of all Falco security events without writing KQL from scratch. It surfaces alert counts by severity, a timeline of events, top offending pods, and a breakdown by namespace — all in a single scrollable dashboard.
To import it, go to Azure Monitor → Workbooks → New → Advanced Editor, paste in the workbook JSON from the workbooks/ directory in the repo, and save it to your resource group.
Investigating a Sentinel Incident
When a Sentinel analytics rule fires it creates an Incident.
Portal change: Microsoft Sentinel has moved to the Microsoft Defender portal (security.microsoft.com). The legacy Azure Portal blade (
portal.azure.com → Microsoft Sentinel) still exists but redirects you there. Use the Defender portal as your primary entry point going forward.
- Go to Microsoft Defender portal and sign in.
- Left menu → Investigation & response → Incidents & alerts → Incidents.
- Open the incident to see the affected entities (pod name, namespace, container ID).
- Use the Attack story and Evidence tabs to visualise lateral movement or related alerts.
- Add notes, assign an owner, and mark severity — the full SOC workflow is available.
To navigate directly to the analytics rules, go to Microsoft Sentinel (still listed under the left nav in the Defender portal) → Configuration → Analytics → Active rules, then filter by “Falco”.
The five analytics rules are designed to escalate gradually: a single cat /etc/shadow from a test pod won’t immediately page your on-call team, but five alerts from the same pod within ten minutes will create a High-severity incident.
Things to Know Before Going to Production
False positives from system namespaces
AKS system components (ama-logs, kube-proxy, azure-policy, omsagent) generate a lot of Falco events. Filter them in your KQL or in the Falco rules themselves:
FalcoLogs_CL
| where output_fields_k8s_ns_name_s !in ("kube-system", "gatekeeper-system")
Secrets management
The Logic App stores the Log Analytics workspace shared key in its workflow definition. In production, move this to Azure Key Vault and reference it using a managed identity.
Rule tuning
The default Falco ruleset is broad. Spend time creating a baseline of what “normal” looks like in your cluster and write macro-based exceptions for known-good behaviour before rolling out alerting in production.
Retention and cost
FalcoLogs_CL on the PerGB2018 pricing tier is billed per GB ingested. A busy cluster with debug-level Falco logging can generate significant volume. Set the appropriate priority threshold in falco-values.yaml for your environment.
Data Collector API deprecation
The legacy Data Collector API used in this demo is functional but Microsoft is moving toward the newer Logs Ingestion API with DCE/DCR. For a long-lived production deployment, consider migrating the Logic App to use the Logs Ingestion API with a managed identity.
Cleaning Up
./scripts/cleanup.shThis removes the resource group and everything inside it.
Wrapping Up
The combination of Falco + Microsoft Sentinel gives you a well-integrated runtime security layer for AKS that doesn’t require commercial tooling. The eBPF driver means zero kernel-module maintenance on managed AKS nodes, Falcosidekick handles the fan-out cleanly, and Sentinel provides the SIEM capabilities (incident management, investigation graph, analytics rules) that a pure Log Analytics setup lacks.
The full source — Bicep modules, Helm values, Sentinel rules, and deploy scripts — is in the repo. Clone it, run ./scripts/deploy.sh, and you’ll have the entire stack up in about 15 minutes.